A SOC homelab with Wazuh, Suricata and the Elastic Stack is the fastest way to build real analyst reflexes, the kind you only get by living with the tools. Three free, open-source pieces: Wazuh for host monitoring and the SIEM front-end, Suricata for network IDS, and the Elastic Stack doing storage and search. It runs on a small VM, or whatever spare laptop you have gathering dust in a drawer. When you are done you will have a dashboard that swallows endpoint logs, catches network attacks, lines them up against MITRE ATT&CK, and lets you hunt through a dataset that actually feels real. Half a Saturday, zero hardware budget.
The short answer
Stand up a working SOC homelab in one pass: the Wazuh single-node installer drops the Indexer, Manager and Dashboard together, Suricata reads packets off a span port and feeds EVE JSON alerts into Wazuh, and one agent enrolls each endpoint. Then you fire your own test attacks (SSH brute-force, a file-integrity change, an IDS signature hit) and watch the pipeline light up against MITRE ATT&CK.
Courses never gave me this. A SOC (Security Operations Center) homelab did. The reflexes, I mean, the kind you only build by living with the tools analysts stare at when something's actually on fire. So here's the lab I keep rebuilding. Three free, open-source pieces: Wazuh (host-based monitoring and SIEM front-end), Suricata for network IDS, and the Elastic Stack doing storage and search. It runs on a small VM, or whatever spare laptop you've got gathering dust in a drawer. When you're done you'll have a dashboard that swallows endpoint logs, catches network attacks, lines them up against MITRE ATT&CK, and lets you hunt through a dataset that actually feels real. Half a Saturday. Zero hardware budget.
Why build a SOC homelab in 2026
Reading the Wazuh docs gets you maybe a third of the way. A good Black Hat workshop, another third. That last stretch is the hard one. Triaging an alert at 3 a.m. with your brain barely online, reaching for the right Kibana filter on pure instinct, watching an agent go dark and actually working out why before you've had coffee. You only get that by pointing the stack at your own boxes and attacking them yourself. That's the whole point of the lab. Cheap, and safe to break. And honestly? It pays off in interviews in a way I didn't expect. Someone who can walk you through the exact rule that fired when they threw mimikatz at a throwaway Windows VM is having a completely different conversation from the person reciting a syllabus.
What you are about to install
Three open-source projects. Here's the job each one does.
- Wazuh (apache-2.0). A host agent on every endpoint, plus a central manager that does the heavy lifting. Rule evaluation, MITRE ATT&CK mapping, integrity monitoring, vulnerability scanning. And the UI you'll basically live inside.
- Suricata (GPLv2). A fast network IDS / IPS that reads packets off a span port or a tap, checks them against the Emerging Threats rule sets, then spits out EVE JSON alerts for Wazuh to grab.
- Elastic Stack (Elastic License v2). Elasticsearch holds and indexes everything. Kibana draws the dashboards. Wazuh bundles both into a single-node installer, so you're spared wiring up OpenSearch or Loki by hand (unless that's genuinely your idea of a good time).
Prerequisites and topology
You can cram the whole thing onto one machine. A VM with 4 vCPU, 8 GB RAM, 50 GB disk running Ubuntu Server 24.04 LTS or Rocky Linux 9 (Wazuh documents both as supported in 2026). Then spin up one or two more VMs to be your monitored endpoints. A Linux box with sshd exposed, plus a Windows VM (the Server 2022 trial does the job fine) so you can poke at the Sysmon integration. Networking is where people trip. Put every VM on a bridged adapter so they share one L2 broadcast domain. That's the trick that lets Suricata actually see traffic in a span setup. Skip it and it just sits there, deaf.
Hyper-V on Windows hosts: your "span port" here is the External virtual switch with "promiscuous mode" turned on for the Suricata VM. On VMware Workstation it's "VMnet0, Bridged" with promiscuous mode allowed in the vmnet config. Get this wrong and Suricata boots up perfectly happy, then never alerts on a single thing. Maddening to debug.
Step 1: Install the Wazuh single-node stack
Wazuh ships an unattended installer that drops the Indexer (its Elasticsearch fork), the Manager (the rule engine), and the Dashboard (its Kibana fork), all in one go. On the dedicated Ubuntu 24.04 VM:
curl -sO https://packages.wazuh.com/4.10/wazuh-install.sh
sudo bash ./wazuh-install.sh -a
Give it 10 to 15 minutes. When it finishes it leaves a wazuh-install-files.tar holding the generated passwords. Copy that off the box right now, before you forget. Regenerating them later is the kind of pain you really don't want to invite.
# Wazuh install final stretch
Wazuh indexer cluster initialized.
Wazuh dashboard installation finished.
--- Summary ---
INFO: Wazuh web interface password: 8t&[redacted]
INFO: You can access the web interface https://<your-server-ip>
 User: admin
 Password: 8t&[redacted]
INFO: Installation finished.
Open https://<your-server-ip> in a browser, wave the self-signed certificate warning through, log in as admin. You'll land on a dashboard showing exactly one agent (the manager talking to itself) and zero alerts. Don't panic. That's expected. Real telemetry comes next.
Step 2: Deploy Suricata and feed alerts into Wazuh
You can park Suricata on the same VM for a tiny lab. Or give it its own sensor VM if you want something closer to a real deployment. That second option is what I'd lean toward, though for a first build either is fine. On Ubuntu 24.04:
sudo apt update
sudo apt install -y suricata
sudo suricata-update
sudo suricata-update update-sources
sudo suricata-update enable-source et/open       # Emerging Threats open ruleset
sudo suricata-update
Crack open /etc/suricata/suricata.yaml and point HOME_NET at your lab subnet (say "[192.168.10.0/24]"). Modern Suricata already writes EVE JSON to /var/log/suricata/eve.json by default, so you're really just confirming it's on. Then name your monitoring interface in the af-packet section. Get that one wrong and you'll be staring at an empty log file, wondering what on earth broke.
Now Wazuh needs to be told where that EVE log lives. On the Wazuh manager, append this to /var/ossec/etc/ossec.conf:
<ossec_config>
  <localfile>
    <log_format>json</log_format>
    <location>/var/log/suricata/eve.json</location>
  </localfile>
</ossec_config>
sudo systemctl restart wazuh-manager
sudo systemctl enable --now suricataStep 3: Enrol the first endpoint agent
Hop onto the Linux endpoint you want to keep an eye on:
curl -sO https://packages.wazuh.com/4.x/apt/pool/main/w/wazuh-agent/wazuh-agent_4.10.0-1_amd64.deb
WAZUH_MANAGER='192.168.10.10' sudo dpkg -i ./wazuh-agent_4.10.0-1_amd64.deb
sudo systemctl daemon-reload
sudo systemctl enable --now wazuh-agent
Inside about 30 seconds the manager auto-enrols the agent and starts pulling in /var/log/auth.log and /var/log/syslog, file-integrity events under /etc and /usr/bin, plus vulnerability scan results. Watching that first agent flip to "active" never quite gets old, even now. Windows is the same idea with wazuh-agent-4.10.0-1.msi. Just set the WAZUH_MANAGER environment variable before you kick off the MSI, or the agent comes up pointed at, well, nothing.
Step 4: The dashboard you should care about
Wazuh hands you a dozen dashboards out of the box. Ignore most of them for now. Two are the ones you'll actually open at first.
The Security Events dashboard is where I start every morning triage. Make it your landing page. The MITRE ATT&CK module chews the same data into a tactics-by-techniques heatmap, so at a glance you can see which kinds of attacker behaviour are lighting up. In a fresh lab that heatmap looks almost empty for the first week. Then you start firing off deliberate test cases (Step 5) and it fills in fast. That moment, honestly, is more satisfying than it has any right to be.
Step 5: Generate test alerts and verify the pipeline
Best way to learn the dashboard? Make it ring. Here are three low-risk tests, each tripping a different class of alert.
SSH brute-force
From a third host (your laptop, another VM, whatever's handy) throw hydra at the Linux endpoint with a password list you know is junk. Wazuh rule 5712 (SSH brute-force) trips after five failed attempts inside 120 seconds.
hydra -L users.txt -P bad-passwords.txt ssh://192.168.10.20Within a minute you should see a burst of Level-5 alerts (failed logins). Then the one you're really after lands: a Level-10 correlation alert (sshd brute-force) showing up on the Security Events dashboard.
File integrity
On the Linux endpoint, poke a watched path and watch the file-integrity-monitoring (FIM) rule fire. Tiny test. Very satisfying.
sudo echo "test" >> /etc/important.conf
# Expected: rule 550 (file modified) fires within 15 seconds
Suricata: known-malicious payload signature
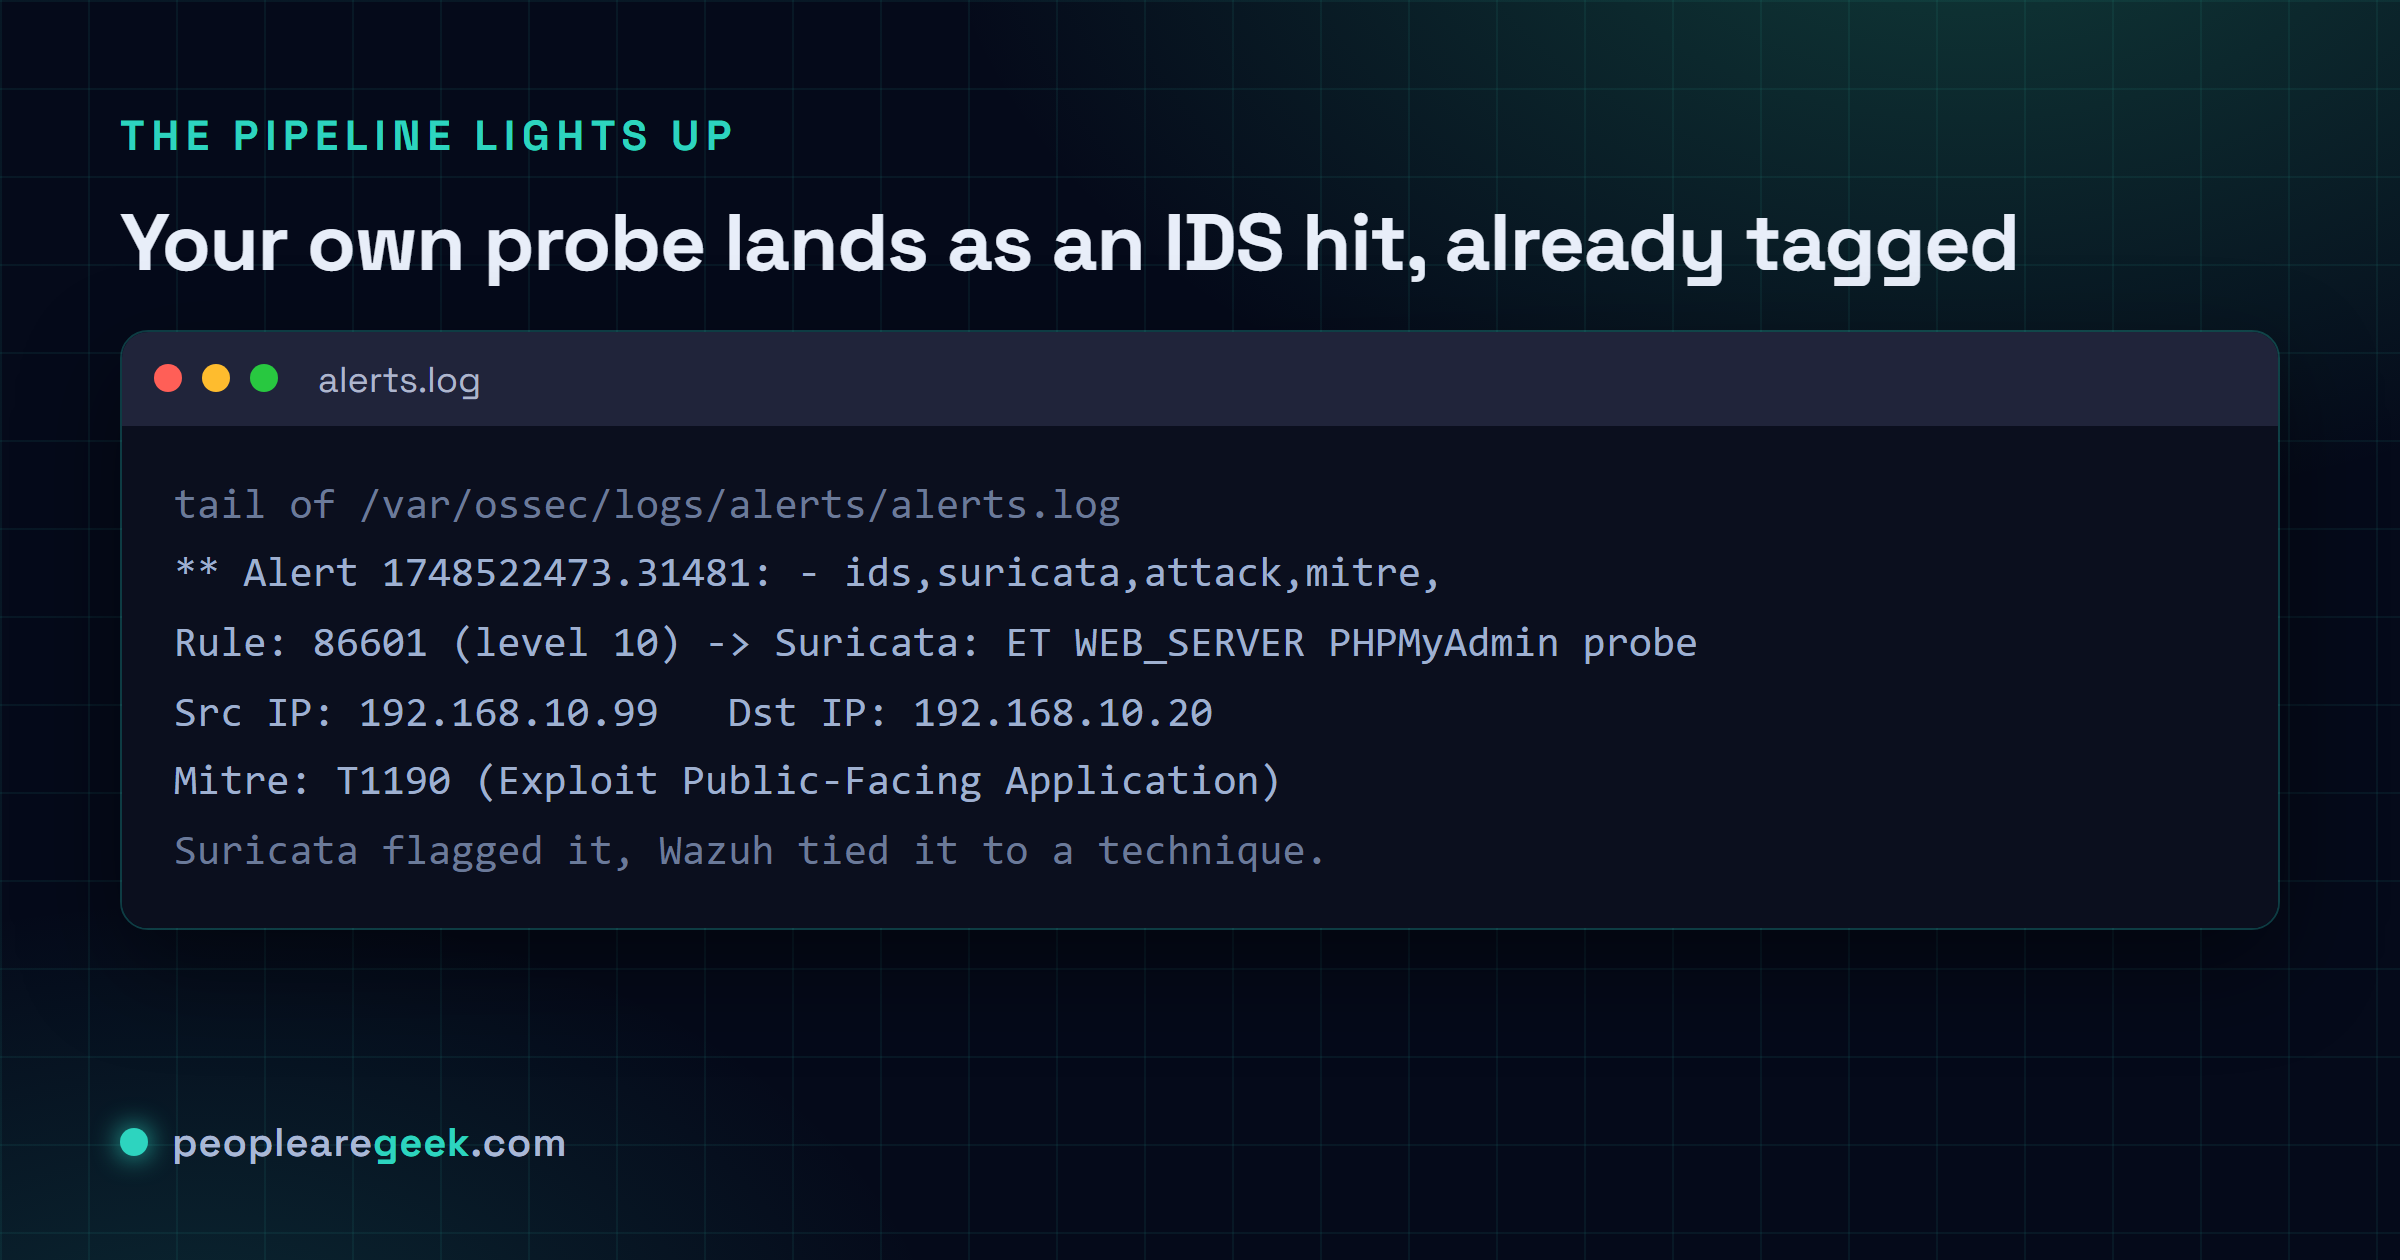
From the third host, curl a domain off the public malicious-URL list. Grab a test sample from the EICAR-test-domain list, which is built to be harmless on purpose. Suricata's ET ruleset matches it and emits an EVE JSON event. Wazuh picks it up, tags it, floats it into the Suricata module of the dashboard. Watching your own harmless probe surface as an IDS hit is, I think, the fastest way to actually trust the pipeline end to end. Reading about it never lands the same.

# Tail of /var/ossec/logs/alerts/alerts.log
** Alert 1748522473.31481: - ids,suricata,attack,mitre,
2026 May 29 14:01:13 wazuh-mgr->/var/log/suricata/eve.json
Rule: 86601 (level 10) -> 'Suricata: Alert - ET WEB_SERVER PHPMyAdmin probe detected'
Src IP: 192.168.10.99
Dst IP: 192.168.10.20
Mitre: T1190 (Exploit Public-Facing Application)
Common pitfalls
- Suricata sees no traffic. Nine times out of ten the interface simply isn't in promiscuous mode. On the Suricata VM run
ip link set ens33 promisc on, then flip promiscuous mode on at the virtual switch as well. Both. Not one. - Agent shows as "disconnected" even though it is running. That's a firewall on the agent host quietly eating outbound tcp/1514.
ss -tnpon the agent, plusjournalctl -u wazuh-agent, will point right at it. - EVE JSON not appearing in alerts. Usually the
<localfile>stanza landed in the wrong section ofossec.conf. Or the path's got a typo in it.sudo tail -f /var/ossec/logs/ossec.logtells you exactly which files the manager actually opened. - Dashboard slow after a week. Elasticsearch keeps indices 90 days by default, and on a 50 GB disk that fills up faster than you'd think. For a lab, set an index-lifecycle policy that rolls daily and deletes after 14 days, then move on with your life.
- Dashboard inaccessible after reboot. The single-node installer expects every service to come up together, so if Elasticsearch trips on boot the dashboard just throws a useless 503 at you. First thing I check:
sudo systemctl status wazuh-indexer wazuh-manager wazuh-dashboard.
Sources and further reading
Frequently asked questions
Can I run this on a Raspberry Pi?
You can. Barely. The Wazuh Manager and Indexer together want 4 GB of RAM minimum, and they are a lot happier with 8. A Raspberry Pi 5 with 8 GB will carry one or two agents, sure, but indexer compaction drags and searches feel sluggish. Honestly, a second-hand Intel NUC i5 is the sweet spot, and that is where I would point you instead.
Is the Elastic stack license a problem?
Not for what you are doing here. Wazuh ships Elasticsearch and Kibana under the Elastic License v2 (forked as wazuh-indexer and wazuh-dashboard), and for a homelab or internal use ELv2 is genuinely fine. The day you decide to resell this as SaaS, swap to the OpenSearch flavour of the installer and that whole restriction just goes away.
How much disk does the data eat?
With two endpoints and one Suricata sensor at default verbosity, I see roughly 1 to 2 GB of indexed events a day. So budget 30 to 60 GB if you want a 30-day window. Once the local disk starts feeling tight, compressed snapshots out to object storage buy you room without touching anything live.
What about OSSEC or Velociraptor instead of Wazuh?
OSSEC is what Wazuh grew out of. Leaner, but no dashboard, and none of the modern rule sets. Velociraptor is a different animal entirely: endpoint forensics and DFIR, not a SOC pipeline. If you are learning in 2026, do Wazuh first for the SIEM mindset, then Velociraptor for the forensic one. I would only reach for OSSEC third, and even then only with a concrete reason in hand.
Is this enough to call myself SOC-ready?
Building the stack gets you the vocabulary. Not the badge. You are SOC-ready the day you can tell the whole story without notes: someone scans the perimeter, Suricata flags it, Wazuh ties it to a failed login, you triage in Kibana, jot a short post-incident note, then tune the rule that fired. Run that loop end to end a few times, with different attack patterns each time. Three is a reasonable floor, though more never hurts.