Core Web Vitals come down to three numbers, and chasing them green eats more late nights than anyone admits. Largest Contentful Paint asks how fast your main content shows up. Interaction to Next Paint asks how fast the page reacts to a click or tap. Cumulative Layout Shift asks whether the page sits still or jumps around as it loads. Google bakes them into its Page Experience signal and paints them as a per-page traffic light in Search Console, and a bad score costs you on competitive queries in 2026. So this is the whole thing, metric by metric: what each one measures, what moves it, how to measure it without lying to yourself, and the budgets that keep you from sliding back next quarter.
The short answer
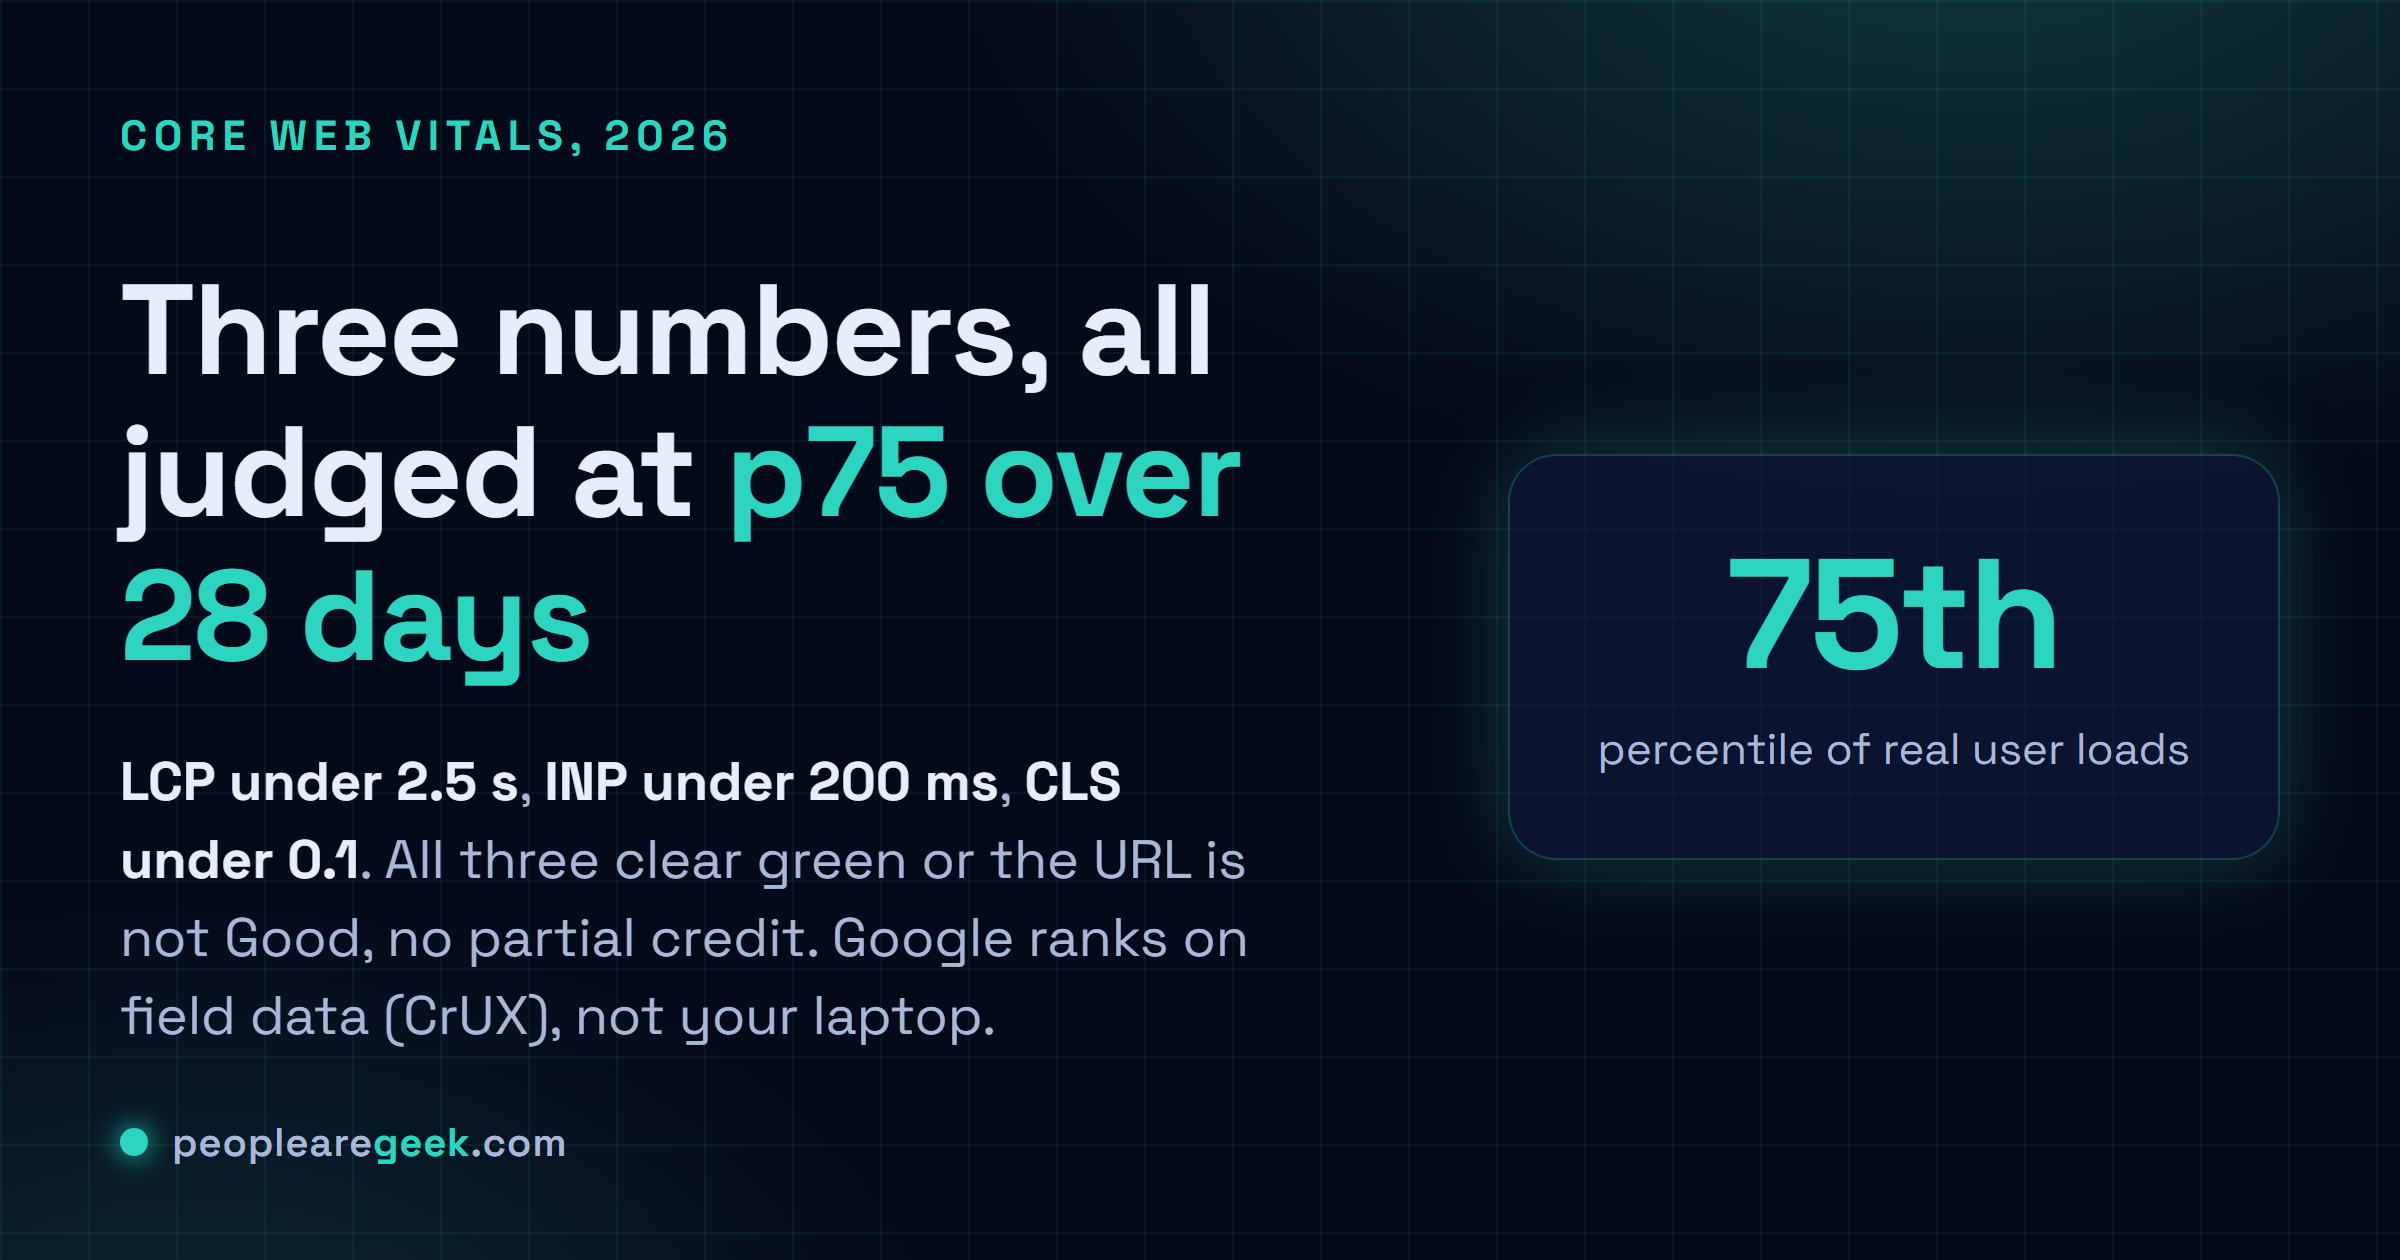
Core Web Vitals are three numbers, all judged at the 75th percentile of real user loads over a rolling 28 days. LCP under 2.5 seconds, INP under 200 milliseconds, CLS under 0.1. All three have to clear green before the URL counts as Good, with no partial credit. Google ranks on field data (CrUX), not your laptop, so instrument your own users and fix what they actually feel.

Three numbers. That's the whole of Core Web Vitals, and I've burned more late nights chasing them green than I'd care to put in writing. Largest Contentful Paint asks how fast your main content actually shows up. Interaction to Next Paint asks how fast the page reacts when someone clicks or taps. Then Cumulative Layout Shift: does the thing sit still while it loads, or jump around like it's possessed? Google bakes them into its Page Experience signal and paints them as a per-page traffic light in Search Console. And yeah, a bad score costs you on the competitive queries in 2026. I've watched it happen. So this is the whole thing, metric by metric. What each one really measures. What moves it. How to measure it without lying to yourself. Which fixes still hold up this year, and the budgets that keep you from sliding right back next quarter.
Why the three numbers matter in 2026
Honest take on the ranking part, and Google's said as much: Core Web Vitals are a signal, just a weak one. Relevance outweighs it. Decent content and links outweigh it. If your page is garbage, all the green in the world won't save it. So why do I keep chasing the badge? Performance moves conversion a lot harder than it moves ranking. Drag a page from a 6-second LCP down to 1.8 seconds and conversion usually jumps 20 to 40 percent, and that shows up long before any SEO bump does. There's a softer reason too, and I won't pretend it doesn't count: a red or green badge in Search Console gets a room full of non-engineers to agree on something. Good luck aligning a marketing team around a flame graph instead.
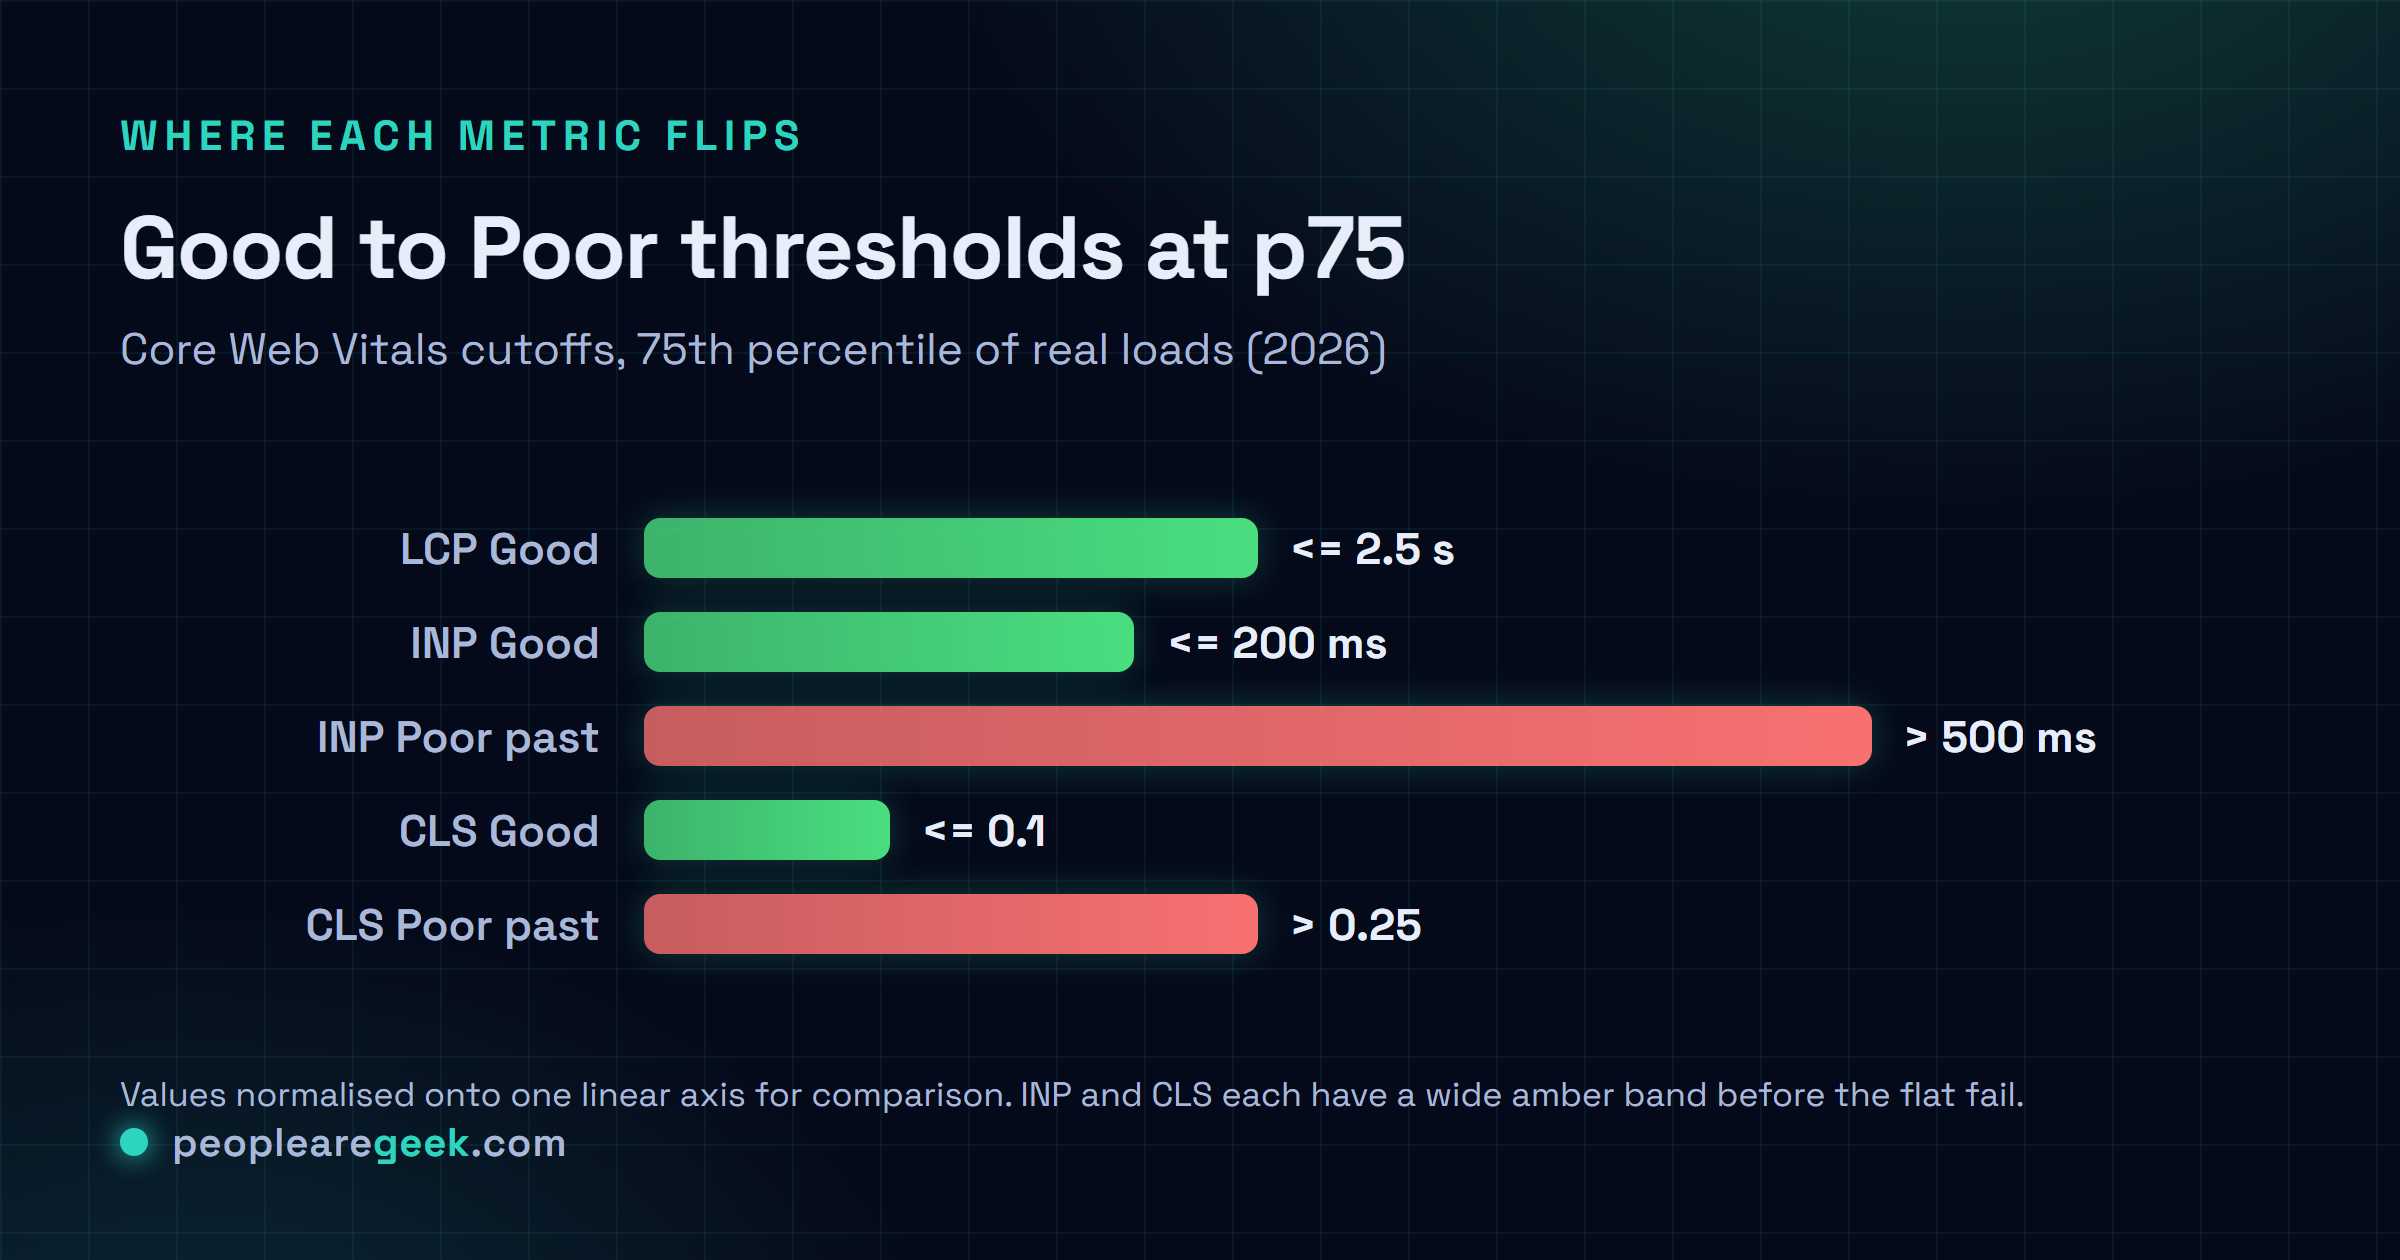
The 2026 cutoffs for "Good": LCP under 2.5 seconds, INP under 200 milliseconds, CLS under 0.1. Each one gets measured at the 75th percentile of real page loads from real users, over a rolling 28-day window. Not your laptop, and not the fast office Wi-Fi either. And the part that catches people out: all three have to clear green at p75 before the URL counts as Good. One amber metric and the whole page slides to "Needs Improvement", with no partial credit.
Lab vs field measurement and which one Google ranks on
Two kinds of measurement, and they argue with each other nonstop. Lab data is the synthetic kind: Lighthouse, PageSpeed Insights, DevTools, one controlled run with the network and CPU throttled to fake some worst case. Field data is the real thing. The Chrome User Experience Report (CrUX) quietly collects it from actual Chrome users who opted in, then rolls it up to the 75th percentile of the last 28 days. And here's what you can't forget: Google ranks on field data. Lab's great for tightening the loop while you work. But a green Lighthouse sitting next to a red CrUX is, hands down, the most common way I've watched a team throw a party for a fix that never reached a single real user.
So how do you settle it? Stop guessing and measure your own users. Drop in the web-vitals JavaScript library, fire the metrics at your own analytics, and you've got a per-page picture today instead of waiting a month for CrUX to catch up. That shorter feedback loop is the whole game:
import {onLCP, onINP, onCLS} from 'web-vitals';

function send(metric) {
  navigator.sendBeacon('/perf', JSON.stringify(metric));
}

onLCP(send);
onINP(send);
onCLS(send);Largest Contentful Paint (LCP) in detail
LCP marks the moment your biggest above-the-fold element finishes painting. Usually that's the hero image or the headline block, sometimes a video's poster frame. You're aiming for 2.5 seconds at p75. In practice the budget gets eaten by your server being slow to answer and by render-blocking junk wedged between the HTML and the paint. When the element's an image or a video, its own load time eats whatever's left. Sort those out and LCP mostly looks after itself.
Server response time
Time to First Byte (TTFB) is your floor, full stop. If TTFB sits at 800 ms, your LCP physically cannot beat 800 ms, doesn't matter how clever the rest of your front end gets. The fix is caching, and it's layered: an edge cache for static pages, an application cache for the personalised ones, then a query cache for the dynamic bits underneath. If I could only do one thing, it'd be HTML caching at the CDN for logged-out visitors. Nothing else comes close on leverage. For logged-in or personalised flows where caching turns hairy, response streaming through the Streams API lets the browser start chewing on HTML before your server's even finished writing it.
Render-blocking resources
Anything synchronous in the head holds your first paint hostage. Every CSS file. Every blocking script. My 2026 baseline goes like this: inline the critical CSS and keep it under 20 KB, then pull the main stylesheet in non-blocking with the media="print" onload trick or rel="preload" as="style". Every script ships with defer or async, or it gets shoved to the end of the body. The classic LCP killer I still trip over all the time? A page dumping 100 KB of CSS across two blocking files, right there in the head.
LCP element load
When the LCP element's an image, a few things earn their keep. The <img> tag has to live in the HTML. Let JavaScript inject it and the browser discovers it late, and you've already lost. Serve it as AVIF or WebP, not some fat old JPEG. Then set fetchpriority="high" on the candidate so the browser knows it's the star. One more, and I see it constantly: do not, ever, slap loading="lazy" on the LCP image. That one careless attribute adds roughly 500 ms in 2026 measurements. It's the kind of bug that hides in a shared component and quietly tanks a whole template.
Interaction to Next Paint (INP) in detail
INP watches every interaction on the page and reports the worst one. An interaction being a click, a tap, a keypress, and the latency is the gap between that input firing and the next frame actually painting the result on screen. Good is 200 ms at p75, and anything up to 500 ms lands you in "Needs Improvement." It replaced First Input Delay back in March 2024, and honestly that swap was overdue. FID only ever clocked the very first interaction, which was usually snappy even on a bloated page. INP catches the slowest one, which is where the pain actually is.
Nine times out of ten, bad INP in 2026 comes down to one thing. Long JavaScript tasks hogging the main thread the second a user does something. This is the playbook I work through, roughly in order of payoff:
- Break up long tasks so the browser can breathe. Drop a
scheduler.yield()(Chrome 129+) or anawait new Promise(r => setTimeout(r, 0))between the expensive chunks and let it paint. - Move heavy compute to a Web Worker and get it off the main thread for good. Our companion guide walks through the whole thing.
- Defer the handlers that don't need to be instant. Someone clicks "Add to cart," you bump the visible cart count first, then the analytics call fires a beat later. They see the result. The bookkeeping can wait.
- Put third-party scripts on trial. Chat widgets and consent banners are the usual suspects, the A/B testing library too. None of them are as cheap as the vendor swears.
- Profile in the DevTools Performance Insights panel, which has surfaced INP-specific call stacks since Chrome 124. It points you straight at the slow handler instead of leaving you to guess.
Want to see it play out for real? The companion piece on INP optimisation in 2026 drags one page from 480 ms down to 120 ms and shows every move that got it there.

Cumulative Layout Shift (CLS) in detail
CLS adds up every unexpected jump a user lives through while the page is open. Every time something shoves the content they were about to tap. Cross 0.1 and you're in "Needs Improvement," cross 0.25 and it's "Poor." The word doing the work here is unexpected: a shift only counts if there was no user interaction in the previous 500 ms. Click something and have it expand a panel or pop a modal? That's intentional, so it's exempt. The 2026 math leans on a "session window", where shifts within a second of each other get bundled into one session, and the worst session is the one that ends up on your scorecard. Which means a single nasty jump can sink you even when the rest of the load is smooth as glass.
The four common CLS sources
- Images and iframes with no dimensions. The browser can't guess how big they'll be, so it reserves nothing, and when they finally load, everything below them lurches down. Set
widthandheight, or lean on aspect-ratio CSS for the responsive ones. Free to fix, and I still find it everywhere. - Web fonts that reflow the text.
font-display: swappaints a fallback first and then swaps in your web font, and if the metrics don't line up, your text resizes and rewraps mid-read. For anything above the fold I reach forfont-display: optional, or I preload the font withrel="preload"so the swap never shows. - Stuff injected above what's already there. The textbook offender is a cookie banner that turns up 800 ms in and shoves the whole page down. Pin it to the bottom of the viewport with absolute positioning, or carve out its space in the initial HTML so nothing has to move.
- Animating the wrong properties. Touch
heightortopand the browser reruns layout every single frame. Animatetransformandopacityinstead, since the compositor handles those without disturbing anything around them.
Performance budgets and CI gates
Here's what nobody warns you about: without a budget, every team slides back. I haven't seen an exception yet. The smallest budget worth having pins two numbers in CI, your JavaScript bundle under 200 KB compressed per route and a Lighthouse performance score above 90 on staging. Wire up bundlewatch and size-limit alongside Lighthouse CI in GitHub Actions, and they'll just refuse the PR the moment either one slips. Saying no to a 10 KB feature feels petty in the moment. Say yes ten times running, though, and you wake up with a 2 MB bundle and no clue where it came from.
Once that's holding, stack a second tier on top: field-data alerts. Wire your web-vitals numbers into Slack or PagerDuty so you get pinged the moment LCP, INP, or CLS p75 drifts out of the green over the last 24 hours. CI never catches these, because they don't happen at build time. They happen when someone in marketing uploads a 5 MB hero image at 4 p.m. on a Friday and wanders off for the weekend, and the build was green the whole time.
A weekly Core Web Vitals workflow
The rhythm I've settled into for 2026 is dead simple. Monday, pull the CrUX 28-day numbers from Search Console, diff them against last week, flag whatever drifted the wrong way. Tuesday, run Lighthouse on your top 20 pages by traffic in staging and check the lab numbers line up with what you'd expect. And no, the deploy window for perf fixes is not Friday afternoon. Ship them early in the week and they've got days to cough up a regression before everyone clocks out. Nothing fancy. It just catches problems while they're still small.
And drop the idea that performance is some heroic one-off. It isn't. One or two small wins a week (defer a script here, compress an image there, carve out space for that banner) compound into something real. Way more reliably than the dreaded quarterly "performance sprint" that eats two weeks and wears everyone out. Funny how that one never gets put back on the calendar.
Common mistakes that block progress
- Chasing the Lighthouse number instead of CrUX. You can sit there at a smug 95 in the lab while your field p75 bleeds red. Fix what your actual users feel, not what your laptop reports back.
- Thinking LCP is just the image. More often the damage is the server, or the render-blocking CSS, or the fonts. The image is what you watch go slow. It's rarely the actual reason.
- Bolting on a third-party tool to "fix" performance. Every one of those ships more code, and I've watched plenty cost more than they ever clawed back. Read the network tab before you buy the pitch.
- Skipping your own field instrumentation. Waiting 28 days for CrUX to tell you whether a fix worked is about the slowest feedback loop going. Ship
web-vitalsfirst and you'll know by tomorrow. - Optimising one metric in isolation. Inline 200 KB of CSS to rescue LCP and you'll quietly wreck INP and FCP on the way out. They move together. Treat the three as one system, or you'll keep playing whack-a-mole forever.
Frequently asked questions
How long after a deploy does Search Console reflect the change?
Slower than you'd like. CrUX averages over a rolling 28-day window, so one deploy barely nudges the field number at first. On a high-traffic page you'll usually catch the first delta around day 7, and the full picture lands at 28 days. Can't wait that long? Honestly, nobody can. Instrument with web-vitals and watch your own analytics, and you'll see the change inside 24 hours.
Do mobile and desktop have different thresholds?
Thresholds are identical (LCP 2.5s, INP 200ms, CLS 0.1) on both. But Search Console reports and ranks them separately, so you'll routinely watch a page sit green on desktop and amber on mobile. And it's nearly always mobile that forces the fix, because mobile is where the slow hardware and the flaky networks actually live.
My LCP element keeps changing, how do I optimise for it?
Right, because LCP is whatever's biggest at the instant of measurement, and different variants of a page can crown different winners. So stop guessing. Use the LCP API to log which element gets picked on each load, then group the results by URL pattern. Optimise the one that wins most often for each pattern, and move on. That long tail of weirdness usually adds up to under 5 percent of loads. Not worth losing sleep over.
Should I aim for the perfect score?
No, and please don't. Hit the Good thresholds at p75, then walk away. Squeezing from green to a perfect 100 costs a fortune in engineering time and buys you basically nothing in ranking. Spend those hours on content or features your users will actually notice.
What about INP for input-heavy applications like text editors?
Yeah, editors are the genuinely hard case, because every single keypress counts as an interaction. The trick is keeping the synchronous work per keystroke tiny, under 16 ms, so the frame always lands on time. Batch the syntax highlighting and the undo-tree bookkeeping with requestIdleCallback, then push anything heavy like autosave or collaboration sync into a Web Worker. That's the pattern behind editors like Notion and Linear, and it's how they hold INP under 100 ms at p75 while you're hammering the keyboard.