INP optimization is the Core Web Vitals problem that still trips up most of the teams I work with. Interaction to Next Paint took over from First Input Delay on the 12th of March 2024, and the catch nobody reads carefully is that INP does not watch the first interaction, it watches the worst one across the whole session. That single definition change yanked the curtain off a pile of latency FID had been quietly papering over. I will walk you through where the number comes from, why your phone always looks worse than your laptop, the twelve patterns I keep tripping over, and the code changes that dragged a production site from 480 milliseconds down to 120 at the 75th percentile.
The short answer
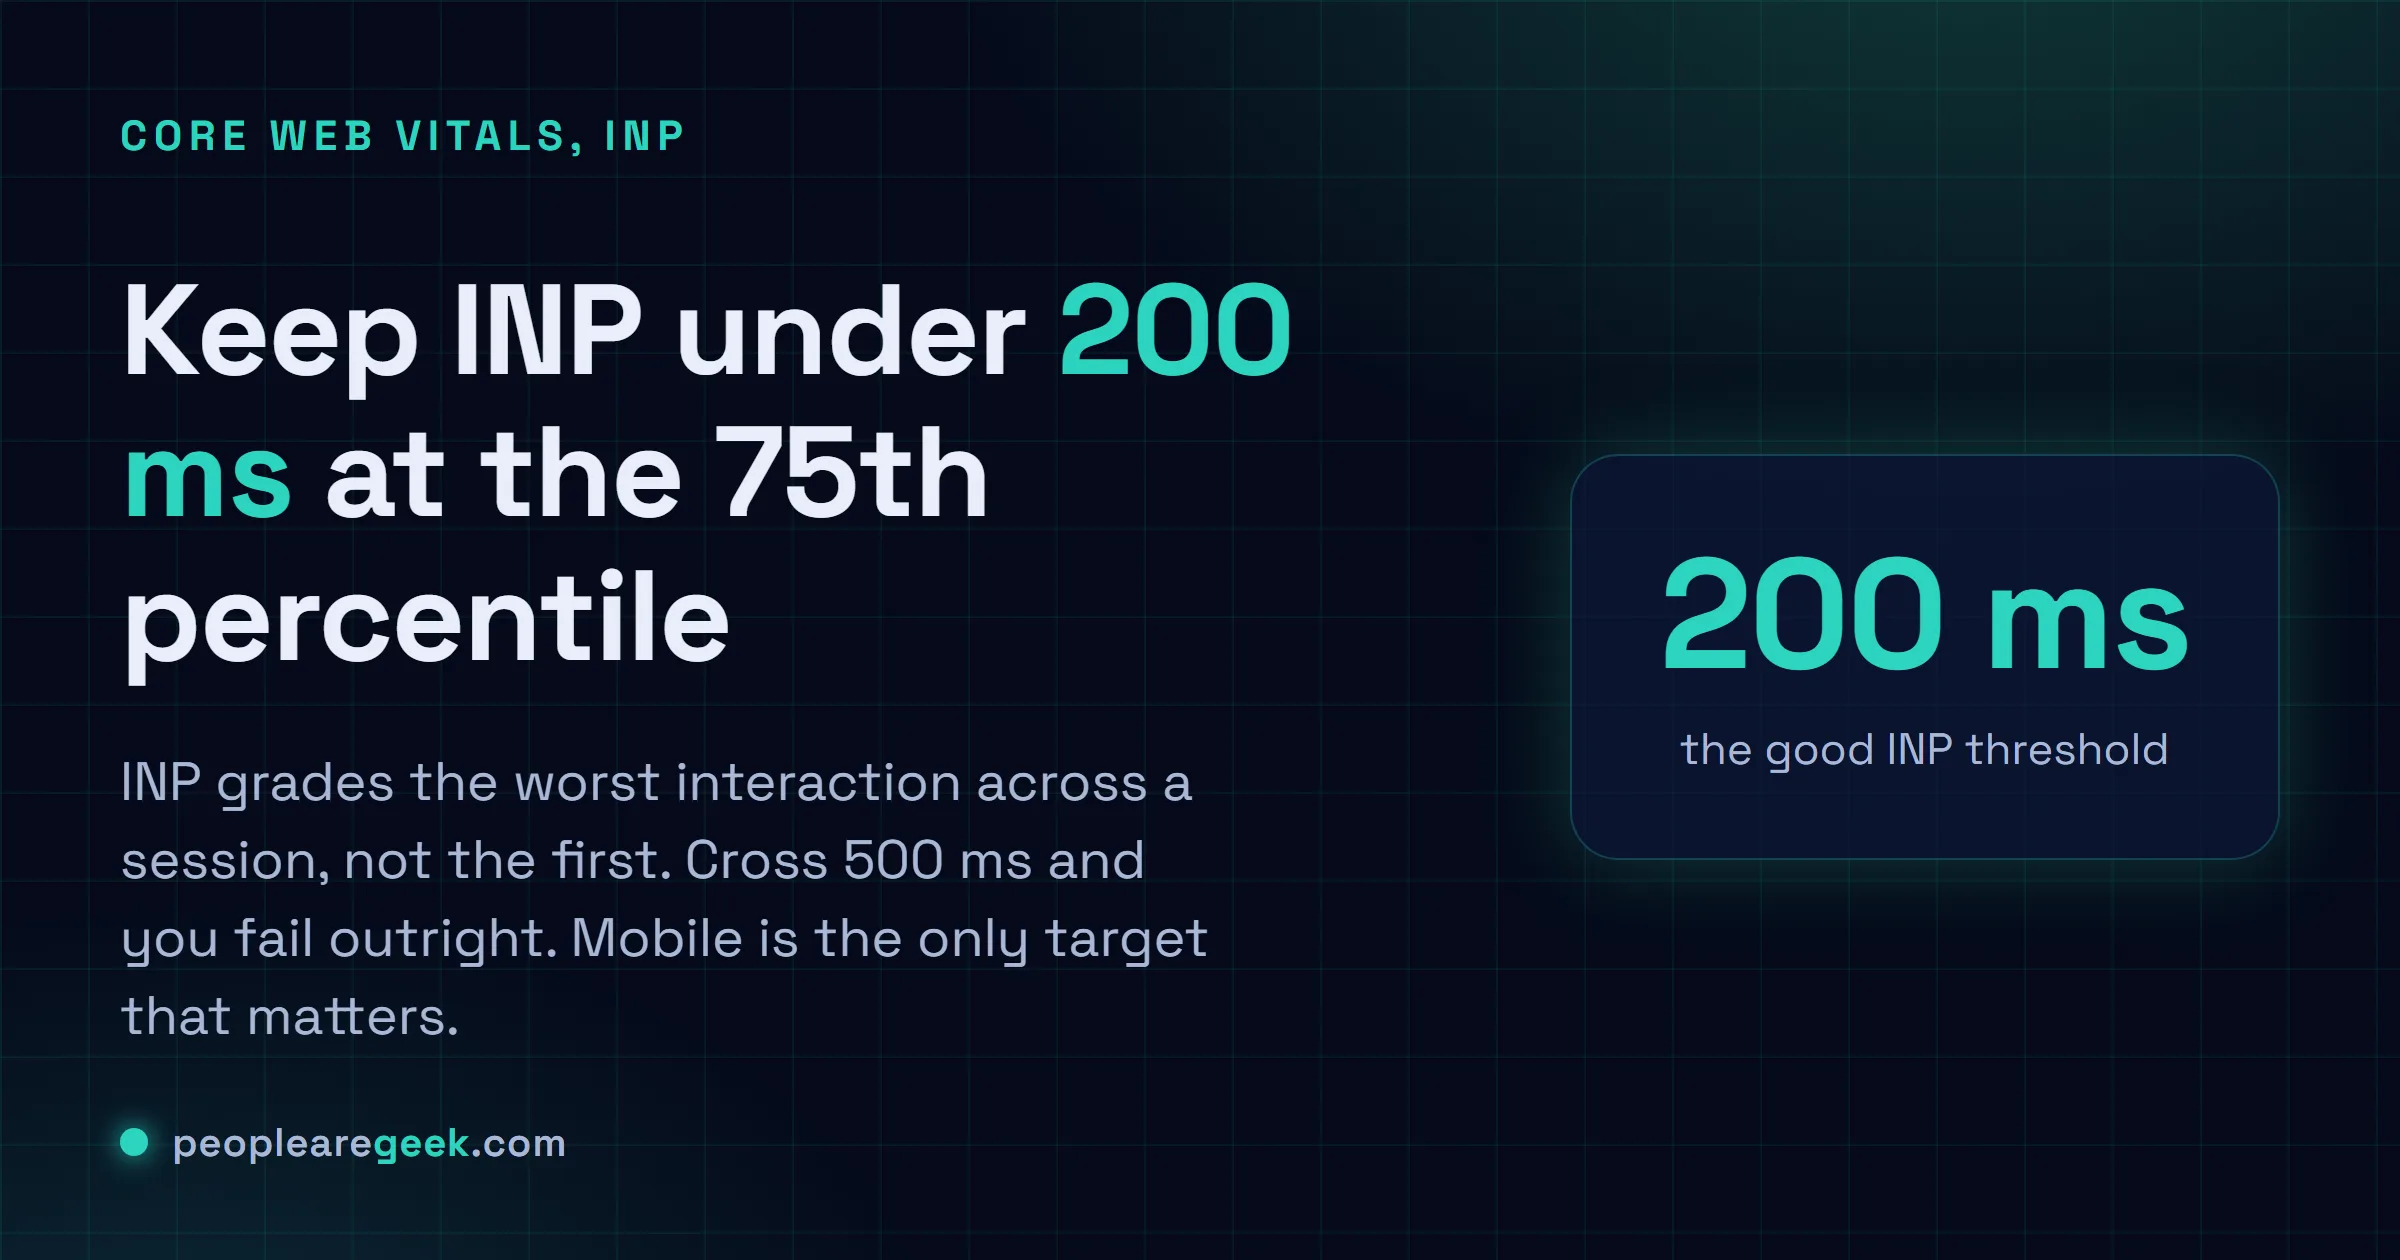
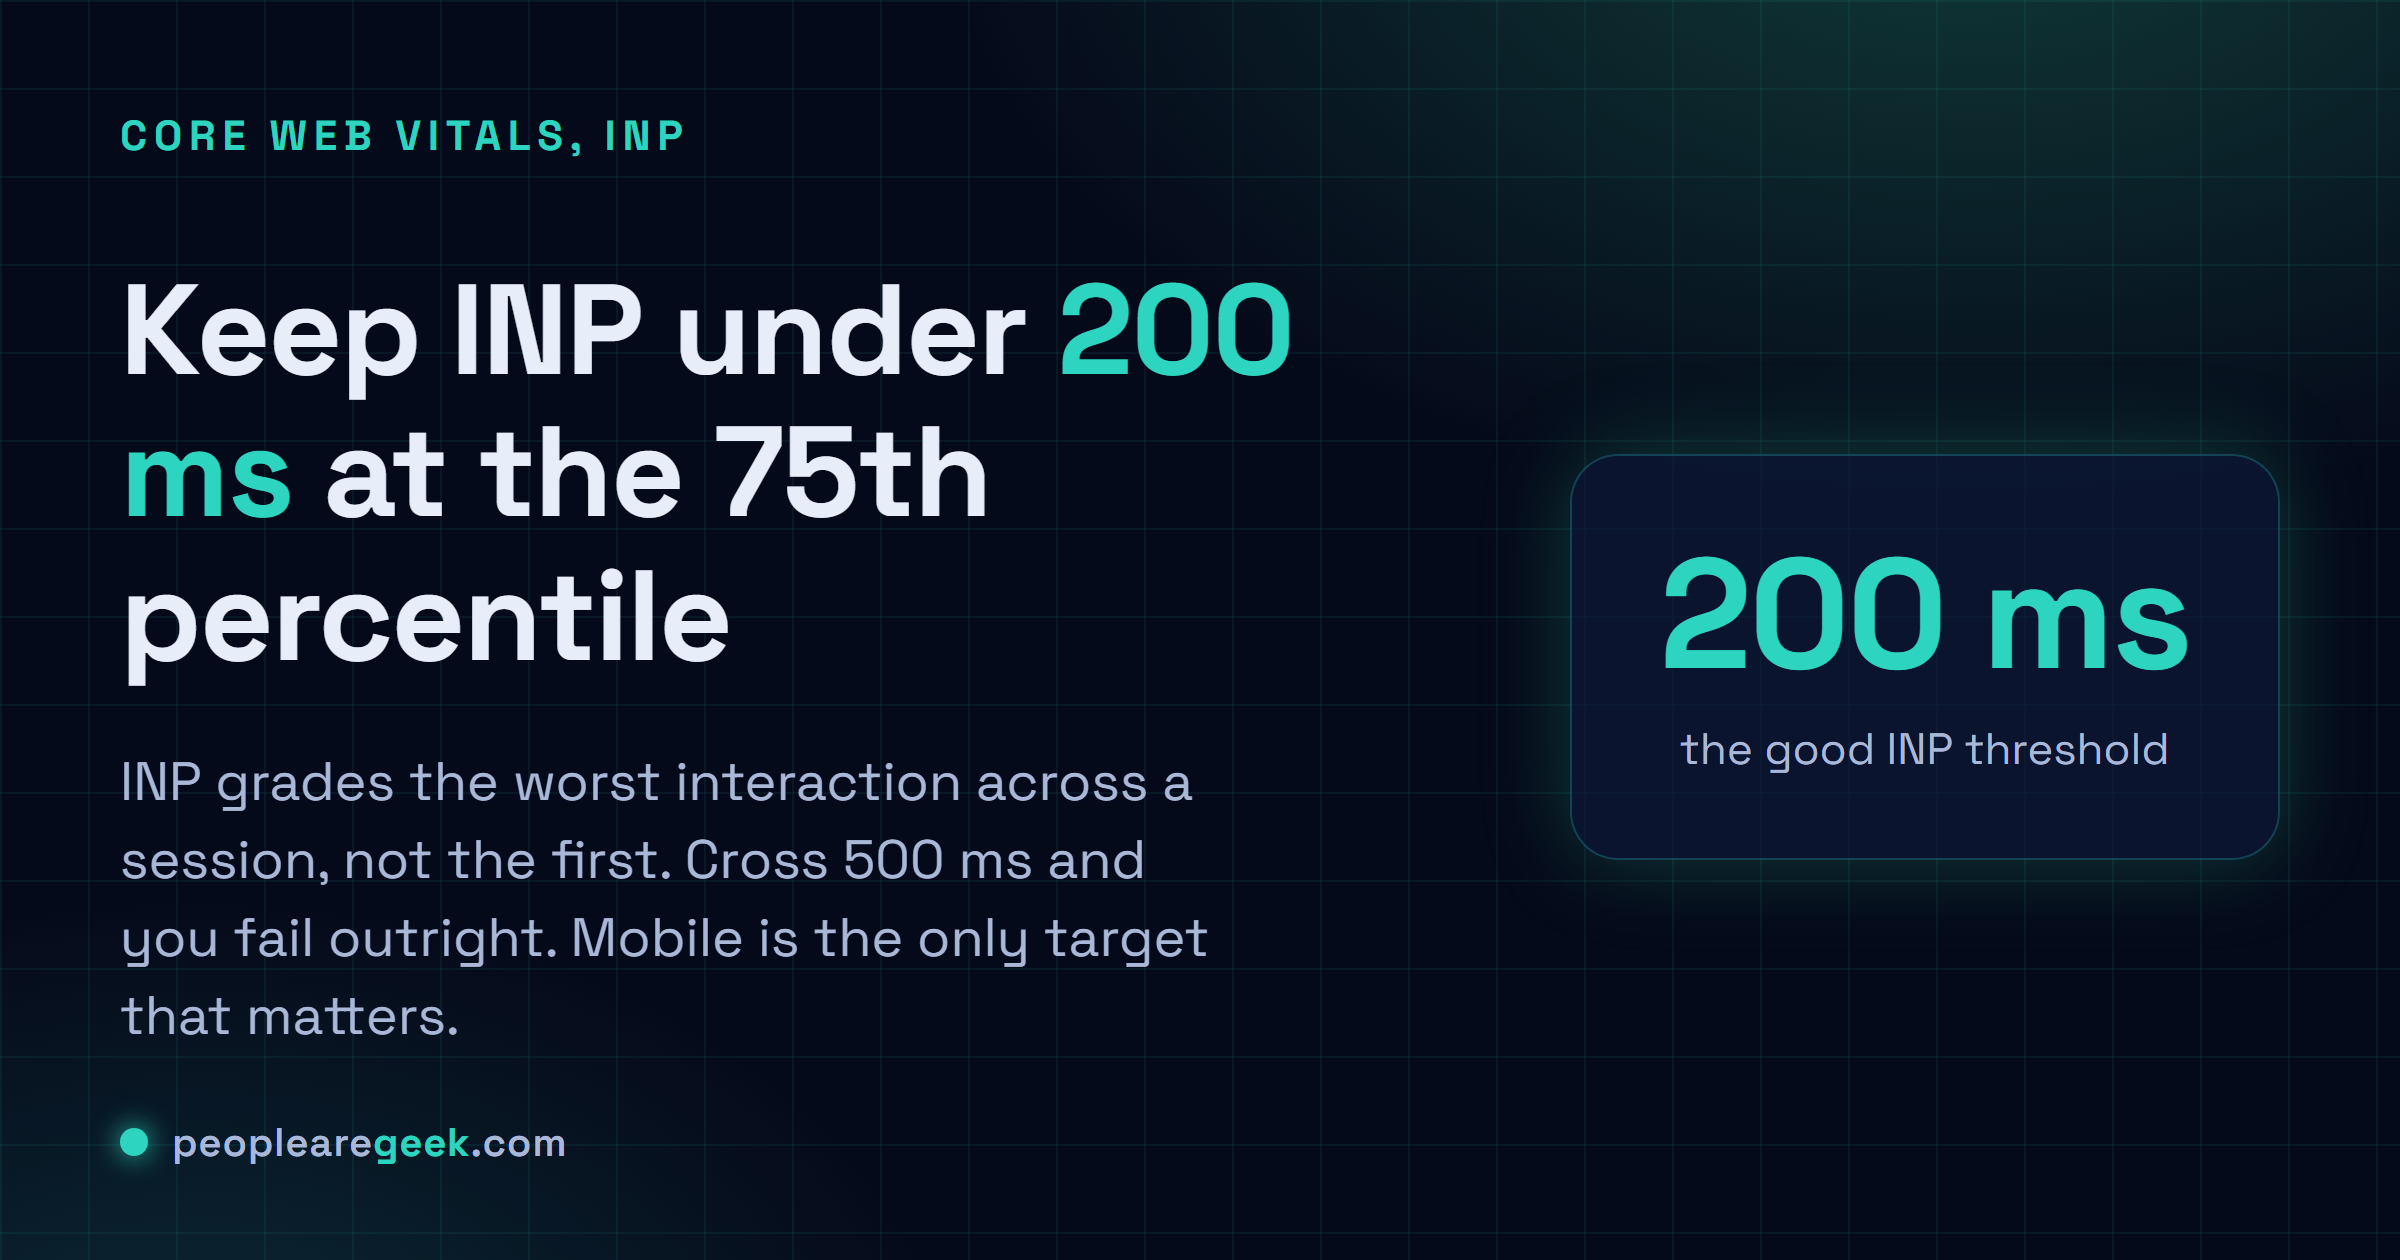
INP grades the worst interaction across a session, not the first one.
Keep it at 200 milliseconds or less for the 75th percentile of visits, and
treat mobile as the only target that matters. Profile under 4x CPU
throttling, chop long handlers with scheduler.yield(), and push CPU-bound
work off the main thread.
INP took over from First Input Delay as a Core Web Vital on the 12th of March 2024. Two years on. And it's still the one that trips up most of the teams I work with. The catch nobody reads carefully: INP doesn't watch the first interaction, it watches the worst one across the whole session. That single definition change yanked the curtain off a pile of latency FID had been quietly papering over. Fat event handlers. The long JavaScript task that only fires on the third click. React and Vue re-renders that cost more than anyone budgeted for, plus the odd web worker that accidentally jams the main thread shut. I'll walk you through where the number comes from, why your phone always looks worse than your laptop, the twelve patterns I keep tripping over in audits, and the actual code changes that dragged one of our production sites from 480 milliseconds down to 120 at the 75th percentile.
What INP measures, in exact terms
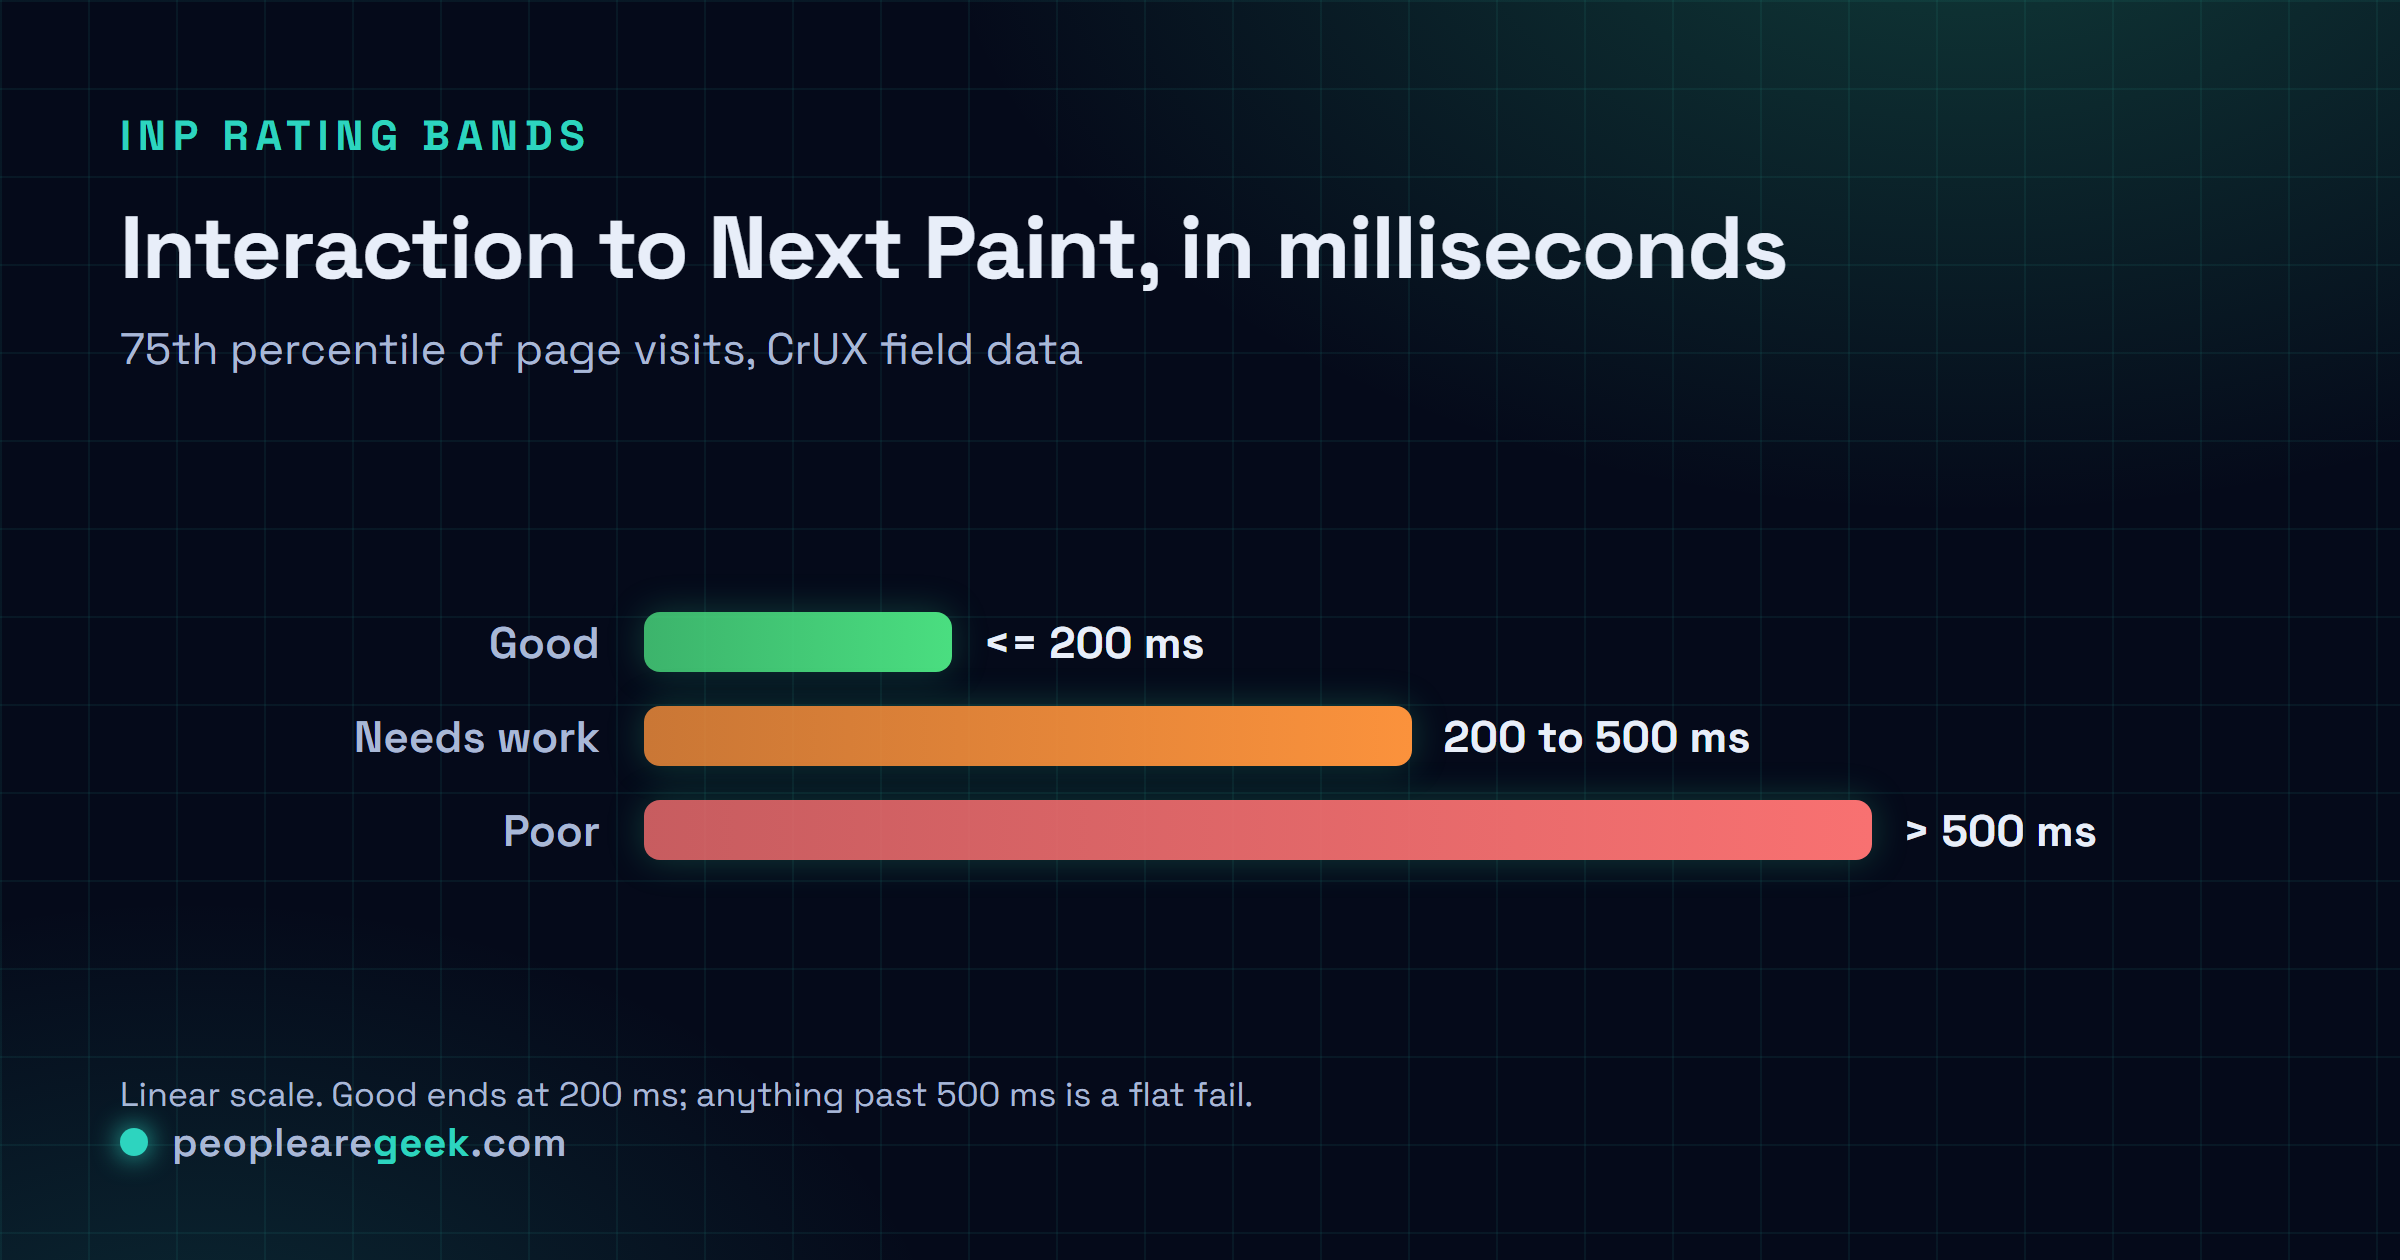
Someone touches the page. A click, a tap, a key press, whatever. The browser starts a stopwatch right then and runs it until the next visual update lands on screen. That window covers running the event handler, plus any styling and layout the browser has to redo afterwards before it can paint the next frame. INP is the tallest of all those windows across the session, minus a handful of outliers and a little smoothing. The bar Google sets: 200 milliseconds or less for the 75th percentile of page visits. Cross 500 and you've failed INP flat out.
And yes, the definition is deliberately mean. FID would happily pat you on the back when the first click flew and the tenth crawled. INP won't. It goes hunting for that slow tenth click, because that's the one your users actually remember. Picture a login form that fires back in 30 milliseconds sitting next to a "load more" button that grinds for 700. INP files the whole page under 700, which, honestly, is exactly what the person sitting there felt.
Why mobile is harder than desktop
Your phone number will be worse than your laptop number. Pretty much always, same site. It's not bad luck either, it's physics. A mid-range Android in 2026 still runs a CPU four to six times slower than a decent laptop. Throw in two to three times less memory bandwidth and a cell network whose jitter randomly stretches even tiny JavaScript tasks, and the React tree that renders in 80 milliseconds on your machine? It can eat 350 on a phone. That alone shoves one click straight past the line.
Which lands me somewhere a lot of people resist hearing: mobile is the only target that matters. Mobile-first indexing means Google ranks you on the phone experience. CrUX field data leans hard toward mobile traffic for most consumer sites. And the ugliest interactions you'll ever ship come from cheap Android handsets nobody on the team owns. So profile with the CPU throttled (4x is the default Chrome DevTools preset, and in 2026 it lines up roughly with a 2022 mid-range Android) and let the desktop wins fall out for free. They will.
The biggest INP killers in 2026
Dozens of these audits in, and the same villains keep showing their faces. Roughly in the order I run into them:
- Heavy event handlers. A click handler that burns 300 milliseconds of synchronous work hands you a 300 millisecond INP, and it could not care less how fast the rest of the page is. The repeat offenders I keep seeing are analytics that fire synchronously, JSON deserialisation, big React state updates that ripple through dozens of components, plus CSV exports that just sit on the main thread and chew.
- Third-party scripts firing during interaction. Tag managers, A/B libraries, session recorders, ad frameworks. They love to kick off a long task the second a user does anything. The page feels snappy right up until that first click trips the third-party code path and freezes the main thread for a few hundred milliseconds. Classic.
- Synchronous layout thrashing. Read a layout property like
offsetHeightorgetBoundingClientRectinside a loop that's also writing to the DOM, and you force the browser to recompute layout on every single pass. It snowballs fast. I've watched a 200-item loop turn into a 200 millisecond stall this exact way. - Large DOM trees. Ship 5000 DOM nodes and every interaction pays a baseline tax, because the browser has to walk a chunk of that tree just to figure out what changed. Lazy-render the panels nobody can see and you're usually fine. Render the whole thing up front and you'll keep paying that tax for the life of the page.
- Web fonts swap that triggers layout shift mid-interaction. A font that lands after the click and triggers a reflow drags your INP up, because the paint that should follow the click gets stuck waiting on the reflow.
font-display: swaphides the visual jank but does exactly nothing for the INP cost.size-adjuston the font face is the fix that actually moves the number. - Long-running setTimeout callbacks. Anything your app schedules that runs past 50 milliseconds gets flagged as a long task. And if it lands on top of an interaction, that interaction inherits the whole delay. Nasty when it's intermittent, because you can't reproduce it on demand.
- Synchronous fetch or XHR in a handler. Await a network request inside an event handler and you've blocked the next paint, full stop. Treat the handler as a synchronous critical path and shove the round-trip out of the way. Optimistic UI, or at the very least a loading state you paint immediately.
- Hydration of large server-rendered components. React 18, Vue 3 and SvelteKit all ship partial-hydration tricks that mop up most of this. But hydrate a 200-component tree on the first interaction and you'll still feel it land. Move to islands or selective hydration wherever the architecture lets you.
Profiling INP with DevTools
For my money, nothing beats the Chrome DevTools Performance panel for pinning down INP in 2026. The "Interactions" track lays out every input event from the recording with its INP score in milliseconds, and any long task that collides with an interaction lights up red so you can't miss it. Here's how I drive it:
- Open DevTools, switch to the Performance tab, and turn on CPU throttling at 4x (the default).
- Set network throttling to Fast 3G or Slow 4G so you're testing something close to a real phone, not your office fibre.
- Hit record, then do the interactions you care about. Pick the ones that feel sluggish. Stop the recording.
- Sort the Interactions track by INP, descending. The top three almost always point you straight at the guilty long task sitting in the Main track right underneath.
- Zoom into that first red long task. The flame chart hands you the name of the function that was running. There's your target. Go fix that one and re-record.
For field data, wire up the Chrome User Experience Report Loop API or just point our Core Web Vitals INP probe at the URL. CrUX hands you the 75th percentile across real Chrome users over the past 28 days, and that's the number Google ranks on. Lab data is sharp, sure, but it's one roll of the dice. Field data is noisy. It's also the truth about your real visitors, so trust that one when the two disagree.
Strategies that actually work in production
If you only do one thing, do this: chop long event handlers into smaller chunks with scheduler.yield() or setTimeout(fn, 0). It's the change that buys me the most, basically every time. The shape looks like this:
async function handleClick() {
  await heavyTask1();
  await scheduler.yield(); // returns to the browser for input checks
  await heavyTask2();
  await scheduler.yield();
  await heavyTask3();
}
Every scheduler.yield() hands the browser a moment to process pending input and paint the next frame. You haven't removed any work. The total's identical. But your worst latency drops from the sum of all the tasks down to just the longest single one, and that's the number INP grades you on.
Next up: get CPU-bound work off the main thread with Web Workers. If it doesn't touch the DOM, it's fair game. JSON parsing, search filtering, encryption, image processing, you name it. It all runs over in the worker, the main thread stays clear, and I've watched INP hold under 100 milliseconds even on the kind of phone you'd hesitate to buy secondhand.
Hold your third-party scripts until the browser's idle with requestIdleCallback or a Partytown-style worker proxy. The page boots on first-party code alone. The trackers slip in only after that first interaction's already been handled, and INP improves a ton, because your worst-case click no longer drags an analytics script along behind it.
Worth adding too: CSS containment (contain: layout style) on components that stand on their own, so a change in one doesn't force the browser to recompute layout across the whole page. One line per component. You won't see a thing in lab tests. Out in the field, though, it adds up.
And finally, preload the assets your first interaction depends on with <link rel="preload" as="script"> for the scripts you already know will run on that first click. By the time the user clicks, the handler's sitting in memory, and you've pulled the parse-and-compile cost clean off the critical path.
Case study, 480 ms to 120 ms
These numbers are real. They're from a production e-commerce site we audited in early 2026. Mobile INP sat at 480 milliseconds at the 75th percentile, basically nudging the 500 millisecond fail line, so the site was failing outright. Three weeks of focused work later it was down to 120, sitting comfortably inside the 200 millisecond "good" band. The part that got the client's attention? Mobile-to-cart conversion climbed 12 percent the following month. Now, I won't swear it was causation, correlation and a hundred other things move a conversion rate, but it sure looked like the snappier feel showed up on the balance sheet.
| Stage | Mobile INP (75th percentile) | Source |
|---|---|---|
| Before | 480 ms | CrUX 28-day field data |
| After | 120 ms | CrUX 28-day field data |
Three changes did almost all the heavy lifting. Biggest win first:
- Flipped "add to cart" from synchronous to optimistic UI. Before, clicking the button fired a synchronous fetch to
/api/cart/addand just sat there waiting for the response before it touched the UI. After: the UI updates the instant you click (item pops into the cart drawer), the fetch runs in the background, and we roll the UI back if it errors out. INP impact: 180 milliseconds off the worst case. This was the big one. - Pushed the tag manager out past the first interaction. They were loading Google Tag Manager synchronously, right there in the head. After: GTM loads with
defer, wrapped in arequestIdleCallbackso it stops elbowing the first click out of the way. INP impact: 130 milliseconds. - Sent product-list filtering off to a Web Worker. The old filter was a synchronous loop over 1200 products that fully re-rendered on every single keystroke. Brutal. After: the worker does the filtering, posts the result back, and the main thread only re-renders the 20 items you can see. INP impact: 50 milliseconds on the filter interaction.

12-point INP optimisation checklist
This is the list I run down on every front-end audit. Each line points at a killer you've already met above, plus the fix that kills it back.
- Profile mobile under 4x CPU throttling first, and don't even glance at the desktop number until mobile goes green.
- Anything longer than 50 milliseconds in an event handler gets broken up with
scheduler.yield(). - Shove CPU-bound, DOM-free work into Web Workers.
- Hold third-party scripts back until
requestIdleCallback, or at the very least until after the first interaction. - Swap synchronous fetch in handlers for optimistic UI plus background reconciliation.
- Drop
contain: layout styleon components that stand on their own. - Preload the scripts your first interaction needs with
<link rel="preload" as="script">. - Never read a layout property inside a loop that's also writing to the DOM. Just don't.
- Set web fonts up with
font-display: swapandsize-adjustso a font swap can't reflow mid-interaction. - If you're deserialising big JSON payloads synchronously, move that to streaming or a worker.
- Check your DOM size. Past 1500 nodes on first load, lazy-render whatever's off-screen.
- Re-measure with CrUX field data after every change. One Lighthouse run will lie to you.
Does HTTP/3 improve INP?
Only at the margins. HTTP/3 trims the TLS handshake and kills head-of-line blocking, so your mobile network behaves more predictably. INP is overwhelmingly about main-thread work, not the network. But a calmer, less jittery connection throws off fewer long tasks from streaming response chunks, and that's the narrow spot where it helps.
Sources and further reading
Frequently asked questions
Why did Google replace FID with INP?
FID only ever clocked the very first interaction. So people optimised that one click and let everything after it quietly rot. INP watches the worst interaction across the whole session instead, and honestly that's a far better stand-in for how the app actually feels to someone using it for real.
What is the difference between TBT and INP?
Think of TBT (Total Blocking Time) as INP's lab-bound cousin: it adds up the time spent in long tasks between FCP and TTI during a simulated load. INP is the field version, straight from real Chrome users. They track each other pretty closely. But TBT can flatter you if your heavy interactions happen late in the page's life, after the lab run's already stopped looking.
How fast should I see a CrUX field-data improvement after a deployment?
Patience. CrUX rolls on a 28-day window, so one deploy nudges the field score along slowly over the next month rather than flipping it overnight. I usually see the first real movement around seven to ten days out, and the full new baseline settles in somewhere near the 35-day mark.
Do single-page apps have a structural INP disadvantage?
Not built in, no. But they hand you a lot more ways to wreck it. Heavy client-side routing, hydration, a re-render on every state change: it all stacks up on your INP. The SPAs I see do just fine lean on islands architecture, signal-based reactivity (Solid, Svelte 5, Vue 3.4+) and as little client-side state as they can get away with, and they keep right up with multi-page apps.
Is the Core Web Vitals INP threshold likely to get stricter in 2027?
My bet is yes, though I could be wrong on the timing. Google's already dropped hints about tightening the good bar once the median web INP comes down. So if you're scraping in at 200 milliseconds today, I'd be shooting for 100 to 150 now and buying yourself room before the next revision lands.