


A SOC (Security Operations Center) homelab gives you something no certification course can: muscle memory for the actual tools analysts use under pressure. This walkthrough builds a complete homelab on three pieces of free, open-source software — Wazuh (host-based monitoring and SIEM front-end), Suricata (network IDS), and the Elastic Stack (storage and search) — running on a small VM or a spare laptop. By the end you will have a dashboard that ingests endpoint logs, detects network attacks, correlates them against MITRE ATT&CK, and lets you run real threat-hunting queries against a representative dataset. Time budget: half a Saturday. Hardware budget: zero.
Contents
- Why build a SOC homelab in 2026
- What you are about to install
- Prerequisites and topology
- Step 1: Install the Wazuh single-node stack
- Step 2: Deploy Suricata and feed alerts into Wazuh
- Step 3: Enrol the first endpoint agent
- Step 4: The dashboard you should care about
- Step 5: Generate test alerts and verify the pipeline
- Common pitfalls
- FAQ
Why build a SOC homelab in 2026
Reading the Wazuh docs gives you 30 percent. Sitting through a Black Hat workshop gives you another 30 percent. The remaining 40 percent — the muscle memory for triaging an alert at 3 am, the instinct for which Kibana filter to type, the practical experience of an agent going dark and figuring out why — only comes from running the stack against your own boxes and inducing your own attacks. The homelab is where that learning happens cheaply and safely. It is also a credible “talk track” in interviews: a candidate who can describe the rule that triggered when they ran mimikatz against a test Windows VM has a different conversation than one who only describes courses they took.
What you are about to install
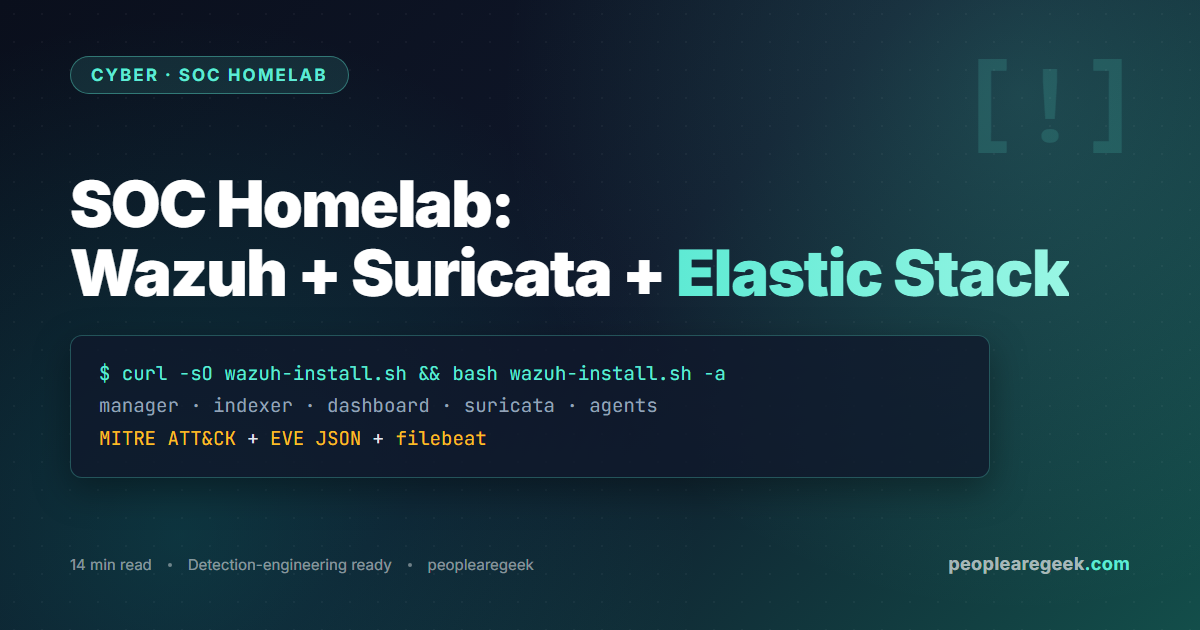
Three open-source projects, each with a clear role in the pipeline.
- Wazuh (apache-2.0) — host agent on every endpoint, central manager doing rule evaluation, MITRE ATT&CK mapping, integrity monitoring, vulnerability scanning, the security analyst’s UI.
- Suricata (GPLv2) — high-speed network IDS / IPS reading packets from a span port or tap, matching them against Emerging Threats rule sets, emitting EVE JSON alerts that Wazuh ingests.
- Elastic Stack (Elastic License v2) — Elasticsearch as the storage and search index, Kibana as the dashboard layer. Wazuh ships a single-node installer that bundles them, so you do not have to wire OpenSearch / Loki yourself unless you want to.
Prerequisites and topology
The minimum viable homelab fits on one machine: a VM with 4 vCPU, 8 GB RAM, 50 GB disk, Ubuntu Server 24.04 LTS or Rocky Linux 9 (both are documented as Wazuh-supported in 2026). On top of that, prepare one or two more VMs as monitored endpoints — a Linux server with sshd exposed, a Windows VM (Server 2022 trial works) to test the Sysmon integration. Networking: bridged adapter on all of them so they share an L2 broadcast domain — that is what lets Suricata see all the traffic from a span configuration.
Step 1: Install the Wazuh single-node stack
Wazuh ships an unattended installer that lays down Indexer (Elasticsearch fork), Manager (rule engine) and Dashboard (Kibana fork) in one shot. On the dedicated Ubuntu 24.04 VM:
curl -sO https://packages.wazuh.com/4.10/wazuh-install.sh
sudo bash ./wazuh-install.sh -a
The script takes 10 to 15 minutes and produces a wazuh-install-files.tar with the generated passwords. Save it offline immediately.
Open https://<your-server-ip> in a browser, accept the self-signed certificate, log in as admin. You land on a dashboard with one agent declared (the manager itself) and zero alerts. That is fine; we add real telemetry next.
Step 2: Deploy Suricata and feed alerts into Wazuh
Suricata can run on the same VM (small lab) or on a dedicated sensor VM (more realistic). On Ubuntu 24.04:
sudo apt update
sudo apt install -y suricata
sudo suricata-update
sudo suricata-update update-sources
sudo suricata-update enable-source et/open       # Emerging Threats open ruleset
sudo suricata-update
Edit /etc/suricata/suricata.yaml: set HOME_NET to your lab subnet (for example "[192.168.10.0/24]"), enable the EVE JSON output (default in modern Suricata) at /var/log/suricata/eve.json. Pick your monitoring interface in the af-packet section.
Now tell Wazuh to ingest the EVE log. On the Wazuh manager, append to /var/ossec/etc/ossec.conf:
<ossec_config>
  <localfile>
    <log_format>json</log_format>
    <location>/var/log/suricata/eve.json</location>
  </localfile>
</ossec_config>
sudo systemctl restart wazuh-manager
sudo systemctl enable --now suricata
Step 3: Enrol the first endpoint agent
On the Linux endpoint you want to monitor:
curl -sO https://packages.wazuh.com/4.x/apt/pool/main/w/wazuh-agent/wazuh-agent_4.10.0-1_amd64.deb
WAZUH_MANAGER='192.168.10.10' sudo dpkg -i ./wazuh-agent_4.10.0-1_amd64.deb
sudo systemctl daemon-reload
sudo systemctl enable --now wazuh-agent
Within 30 seconds the manager auto-enrols the agent and starts ingesting /var/log/auth.log, /var/log/syslog, file-integrity events under /etc and /usr/bin, and vulnerability scan results. The Windows installer is the equivalent wazuh-agent-4.10.0-1.msi, with the WAZUH_MANAGER environment variable set before the MSI invocation.
Step 4: The dashboard you should care about
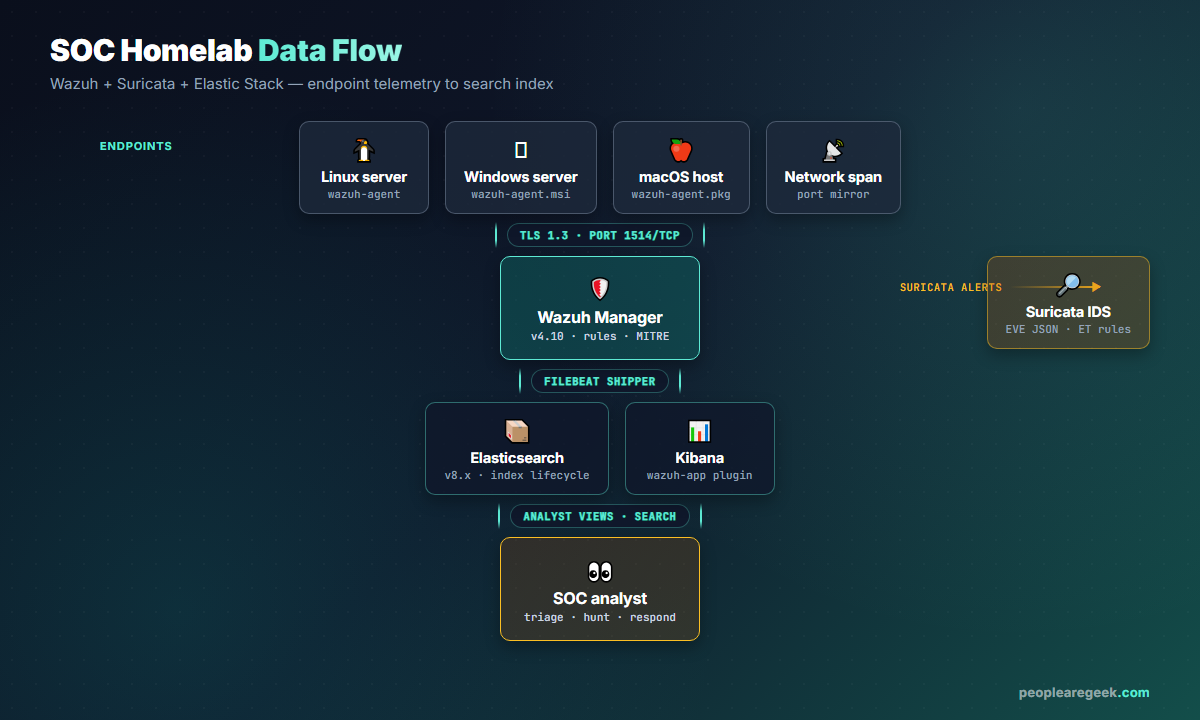
Out of the box, Wazuh ships a dozen dashboards. Two matter most early on.
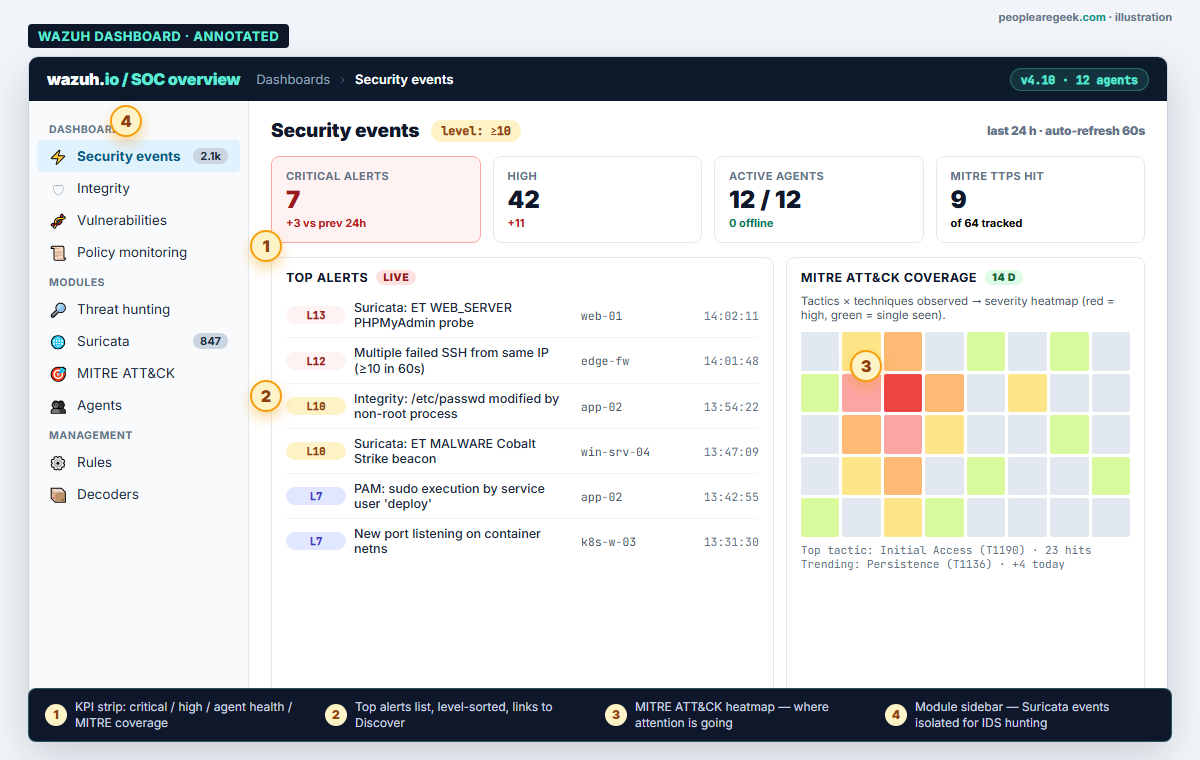
The Security Events dashboard is your default landing page during the morning triage. The MITRE ATT&CK module turns the same data into a tactics-by-techniques heatmap so you can see which classes of attacker behaviour are most active in your environment. For a homelab, expect the heatmap to be sparse for the first week and then fill in fast once you start running deliberate test cases (see Step 5).
Step 5: Generate test alerts and verify the pipeline
The healthy way to learn the dashboard is to make it ring. Three low-risk tests that produce different alert classes.
SSH brute-force
From a third host (your laptop or another VM), run hydra against the Linux endpoint with a deliberately bad password list. The Wazuh rule 5712 (SSH brute-force) fires after five failed attempts within 120 seconds.
hydra -L users.txt -P bad-passwords.txt ssh://192.168.10.20
Expected within a minute: a flurry of Level-5 alerts (failed login), then a Level-10 correlation alert (sshd brute-force) on the Security Events dashboard.
File integrity
On the Linux endpoint, modify a watched path and watch the file-integrity-monitoring (FIM) rule trigger.
sudo echo "test" >> /etc/important.conf
# Expected: rule 550 (file modified) fires within 15 seconds
Suricata: known-malicious payload signature
From the third host, run a curl against a domain on the public malicious URL list (use a test sample from the EICAR-test-domain list — designed to be safe). Suricata’s ET ruleset matches and emits an EVE JSON event; Wazuh ingests it, classifies it, and surfaces it in the Suricata module of the dashboard.
Common pitfalls
- Suricata sees no traffic. The most common cause is the network interface is not in promiscuous mode. On the Suricata VM run
ip link set ens33 promisc on, and on the hypervisor enable promiscuous mode on the virtual switch. - Agent shows as “disconnected” even though it is running. Firewall on the agent host blocking outbound tcp/1514.
ss -tnpon the agent andjournalctl -u wazuh-agentusually pinpoint it. - EVE JSON not appearing in alerts. The
<localfile>stanza inossec.confwas added to the wrong section, or the path is wrong.sudo tail -f /var/ossec/logs/ossec.logshows what files the manager is reading. - Dashboard slow after a week. Default Elasticsearch index retention is 90 days; on a 50 GB disk that fills fast. Set an index-lifecycle policy that rolls indices daily and deletes after 14 days for a homelab.
- Dashboard inaccessible after reboot. The single-node installer assumes all services start together; if Elasticsearch fails the dashboard returns a useless 503.
sudo systemctl status wazuh-indexer wazuh-manager wazuh-dashboardis your first stop.
Run a security audit while you build?
Our Cyber Audit Suite shows you in 20 seconds where the public-facing surface of your lab is exposed before you start ingesting alerts.
FAQ
Can I run this on a Raspberry Pi?
The Wazuh Manager + Indexer combo wants 4 GB RAM minimum and prefers 8 GB; a Raspberry Pi 5 with 8 GB works for a lab with one or two agents, but indexer compaction will lag and search latency is poor. A second-hand Intel NUC i5 is the typical sweet spot.
Is the Elastic stack license a problem?
Wazuh’s distribution ships Elasticsearch and Kibana under the Elastic License v2 (Wazuh forked them as wazuh-indexer and wazuh-dashboard). For homelab and internal use, ELv2 is fine. For SaaS resale, switch to the OpenSearch flavour of the installer, which removes the ELv2 restriction.
How much disk does the data eat?
In a homelab with two endpoints and one Suricata sensor, expect roughly 1 to 2 GB of indexed events per day at default verbosity. Plan 30 to 60 GB if you want to keep a 30-day retention. Compressed snapshots to object storage are an option once you outgrow the local disk.
What about OSSEC or Velociraptor instead of Wazuh?
OSSEC is the project Wazuh forked from; it is leaner but missing the dashboard and the modern rule sets. Velociraptor is a different beast — endpoint forensics and DFIR rather than a SOC pipeline. The healthiest learning order in 2026 is Wazuh first (you get the SIEM mindset), Velociraptor second (you get the forensic mindset), OSSEC third only if you have a specific reason.
Can I add MISP for threat intelligence?
Yes, and it is a natural next step. MISP runs as an additional VM, pulls feeds, and exposes a REST API. Wazuh can correlate inbound IPs and hashes against MISP indicators using a custom integration script. Plan it for week two of the homelab; do not bite it off on day one.
Is this enough to call myself “SOC-ready”?
Building the stack gives you the platform vocabulary. The real SOC-ready milestone is when you can describe a complete incident: someone scans the perimeter, Suricata flags it, Wazuh correlates with a failed login, you triage in Kibana, write a short post-incident note, and tune the rule that fired. Aim to walk through that loop end-to-end at least three times with three different attack patterns.