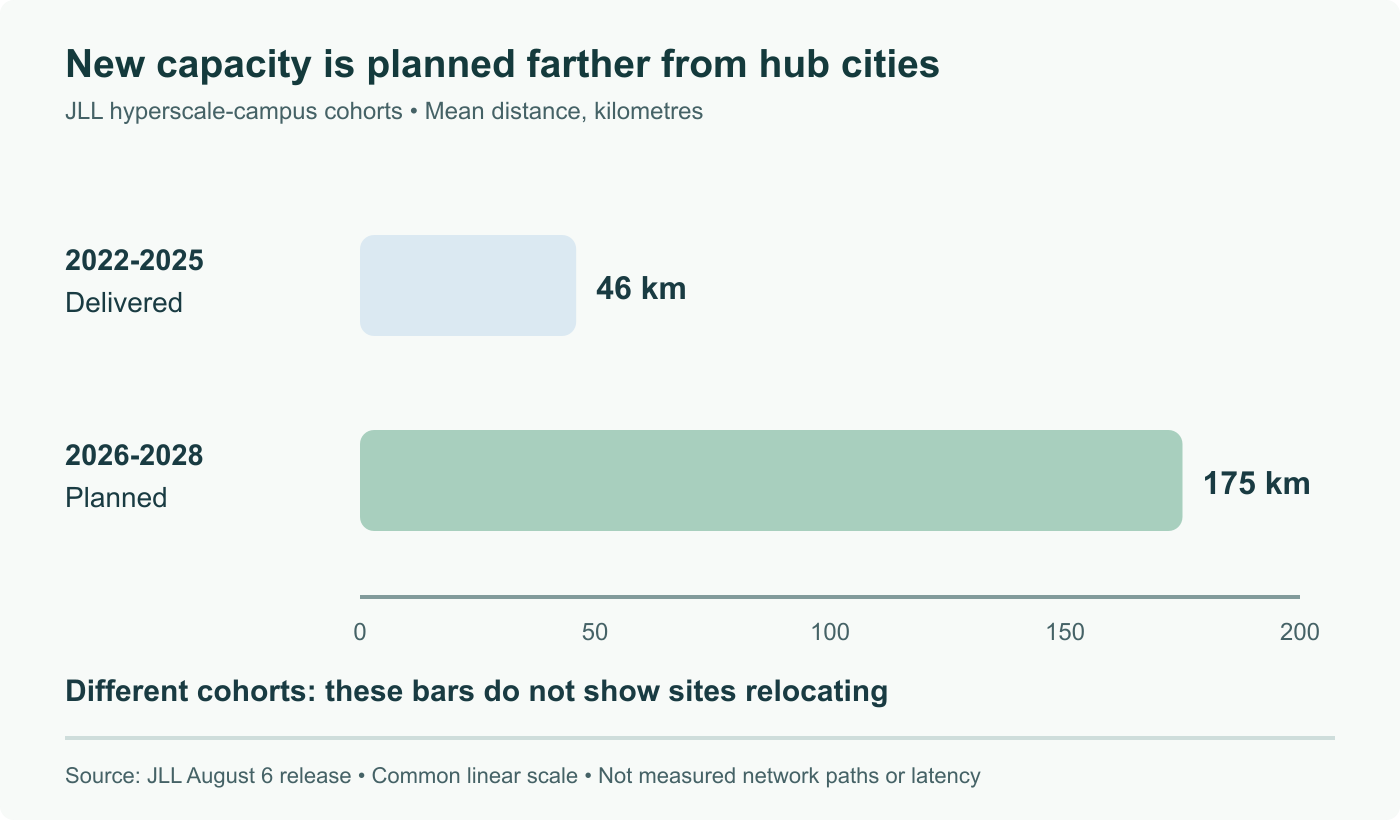
European data centres planned between 2026 and 2028 sit an average of 175 kilometres from the major hub cities, against 46 kilometres for the hyperscale campuses delivered between 2022 and 2025. That figure comes from a JLL report covered by Reuters on Wednesday, August nineteenth, 2026, and it is the clearest number yet on something network teams have been feeling for a while. Capacity is no longer built where the users are. It is built where the electricity is. Here is what the report actually says, and the round trip time you should budget for as a result.
The short answer
A JLL report covered by Reuters on Wednesday, August nineteenth, 2026 finds European data centre projects planned for 2026 to 2028 sit an average of 175 kilometres from the major hub cities, against 46 kilometres for hyperscale campuses delivered between 2022 and 2025. Greenfield sites rise to 39 percent of the pipeline from 8 percent, and inner city projects fall to 5 percent from 13 percent. Powered land runs 2.36 million euros per megawatt in core markets against 512,000 euros in tertiary areas.
Anyone who has priced a cross connect in Frankfurt in the last two years already suspected this. Now there is a number attached.
The finding
JLL looked at the European data centre pipeline and measured how far new projects sit from the established hub cities. Projects planned for delivery between 2026 and 2028 average 175 kilometres out. Campuses delivered between 2022 and 2025 averaged 46 kilometres. Reuters reported the figures on Wednesday, August nineteenth, 2026.
Two supporting numbers make the shift concrete. Greenfield sites, meaning entirely new builds on undeveloped land rather than expansions of existing campuses, rise to 39 percent of the future pipeline against 8 percent of what has already been delivered. Inner city projects fall the other way, to 5 percent of the pipeline from 13 percent.
The scale behind it is not subtle. JLL puts hyperscale cloud provider spending at 725 billion dollars in 2026 against 410 billion dollars in 2025, a 77 percent increase, and projects AI workloads reaching roughly half of all global data centre capacity by 2030.
Why power won the argument
The cost figures explain the migration on their own. Powered land, meaning land that comes with a usable grid connection rather than land you then have to electrify, runs at 2.36 million euros per megawatt in core markets. Secondary markets sit at 978,000 euros. Tertiary areas come in at 512,000 euros and can drop as low as 200,000.
The most expensive individual markets are Amsterdam at roughly 2.7 million euros per megawatt, London at 2.6 million and Frankfurt at 2.5 million. The core set is Frankfurt, London, Amsterdam, Paris and Dublin. Copenhagen, Warsaw and Milan are named as secondary. Bordeaux, rural Spain and northern Sweden appear on the tertiary list.
Assad Noori of JLL stated the logic plainly, saying the determining factor is increasingly where sufficient power can be secured rather than where demand exists, and that data centres are being brought to where the power is rather than the other way around. His colleague Martin Jensen made the same point from the demand side, noting that hyperscale AI infrastructure requires a completely different scale of power and land than what came before.
This is not a new tension, but the direction of travel has hardened. We covered the same forces producing a very different outcome when New York moved on a data centre moratorium and when a gigawatt scale campus went up next to its own generation. Europe's version of the problem is grid access rather than local politics, but the result is identical. Capacity ends up wherever the electrons already are.
What 175 kilometres does to your round trip time
This is the part worth doing the arithmetic on, because the number is smaller than most people fear and larger than most architectures assume.
Light in fibre travels at roughly 200,000 kilometres per second, which is about 5 microseconds per kilometre. A straight 175 kilometre path is therefore around 875 microseconds one way, or 1.75 milliseconds round trip. At 46 kilometres the equivalent is about 460 microseconds round trip. The physics alone adds roughly 1.3 milliseconds.
Then reality intervenes. Fibre routes follow motorways, railways and rights of way rather than straight lines, so the cable distance typically runs 1.3 to 1.5 times the map distance. Optical amplifiers, regeneration points and every router hop add their own microseconds. A realistic planning figure for a site at that distance is 2 to 3 milliseconds of extra round trip time, not 1.75.
What actually breaks, and what does not
Two or three milliseconds sounds trivial, and for most of what you run it is. The distinction that matters is not how sensitive a workload is in absolute terms, it is how many sequential round trips it makes.
Training is batch work. It does not care. Put it wherever the megawatt is cheapest and stop thinking about it.
Inference serving user facing requests does care, but usually at the tens of milliseconds scale, because generating a response takes far longer than the network leg. Adding 3 milliseconds to a request that already takes 400 is a rounding error. Adding it to a first token latency budget of 200 milliseconds is still fine.
What genuinely suffers is anything chatty. Synchronous database replication pays the round trip on every commit. Distributed locks and consensus protocols pay it on every acquisition. Storage protocols designed for a rack pay it on every operation. Any request pattern that makes fifty sequential calls turns 3 milliseconds into 150. The classic failure here is not a slow application, it is an application that was fine in one metro and falls over when someone moves half of it, because nobody counted the round trips.
The practical consequence is a placement question rather than a rewrite. Keep the chatty tiers together. Let the batch tiers go wherever power is cheap. And when you evaluate capacity in a tertiary market, ask for the actual fibre route length between that site and your existing footprint rather than the distance on a map, because that is the number that determines what you can safely put there.
Sources and further reading
- Europe AI data centres seek cheaper, quicker energy and land, Reuters, August 19, 2026
- JLL Report: How AI is Redrawing Europe's Data Centre Map, Data Centre Magazine, August 2026
- AI is changing the European data center landscape, Cloud News, August 2026
- Europe is hungry for AI data centres but its energy grid cannot feed them, Euronews, May 5, 2026
Frequently asked questions
What exactly did the JLL report find?
European data centre projects planned for delivery between 2026 and 2028 average 175 kilometres, or about 109 miles, from the major hub cities. Campuses delivered between 2022 and 2025 averaged 46 kilometres. Greenfield sites rise to 39 percent of the future pipeline against 8 percent of projects already delivered, and inner city projects fall to 5 percent of the pipeline from 13 percent. Reuters reported the findings on Wednesday, August nineteenth, 2026. The report also projects AI workloads reaching roughly half of global data centre capacity by 2030, with hyperscale cloud provider spending at 725 billion dollars in 2026 against 410 billion dollars in 2025.
Why are operators moving so far out?
Power availability and land cost, in that order. JLL puts powered land in core markets at 2.36 million euros per megawatt, against 978,000 euros in secondary markets and 512,000 euros in tertiary areas, dropping as low as 200,000 euros. Amsterdam is the most expensive at roughly 2.7 million euros per megawatt, ahead of London at 2.6 million and Frankfurt at 2.5 million. Assad Noori of JLL summed up the shift by saying the determining factor is increasingly where sufficient power can be secured rather than where demand exists, and that data centres are being brought to where the power is rather than the other way around.
How much extra latency does 175 kilometres cost me?
Light travels through fibre at roughly 200,000 kilometres per second, which works out to about 5 microseconds per kilometre. A straight 175 kilometre path is therefore around 875 microseconds one way and 1.75 milliseconds round trip, against roughly 460 microseconds round trip at 46 kilometres. So the physics alone adds about 1.3 milliseconds. Real fibre routes are not straight lines and typically run 1.3 to 1.5 times the map distance, and every regeneration point, optical amplifier and router hop adds its own delay on top. Budgeting 2 to 3 milliseconds of extra round trip time for a site at that distance is a realistic planning figure.
Which European markets are gaining and which are losing?
The traditional core is Frankfurt, London, Amsterdam, Paris and Dublin, often abbreviated FLAP-D, and these are where the constraint bites hardest. Secondary markets named in the report include Copenhagen, Warsaw and Milan. Tertiary areas gaining share include Bordeaux, rural Spain and northern Sweden. The pattern is consistent, which is that the cheaper the powered land and the shorter the grid connection wait, the more of the new pipeline a region attracts. Nebius' first UK AI data centre at Ark Data Centres in Chertsey was cited as an example of the newer siting logic.
Does this change how I should design my architecture?
It changes what you decide to place where, more than how you build any single tier. Training is batch work and is almost completely insensitive to a couple of milliseconds, so it belongs wherever power is cheapest. Inference serving user facing requests is sensitive, but usually to tens of milliseconds rather than single digits, so a distant site is still workable. What genuinely suffers is anything chatty, meaning synchronous database replication, distributed locks, storage protocols and any request pattern that makes many sequential round trips. If your architecture assumes compute and data sit in the same metro, that assumption is the one worth revisiting before you sign for capacity 175 kilometres away.