SysadminNews

Google Engineer Sends the Raspberry Pi AXI PMU to Mainline

On this page
  1. What these counters see that yours do not
  2. Out of tree is not the same as available
  3. The Pi 5 work is the one to watch
  4. How to use it when it lands
  5. Sources and further reading

On August 11, 2026, Ian Rogers of Google posted a patch series to the kernel mailing list that gives the Broadcom AXI performance monitoring unit on Raspberry Pi boards a real, mainline Linux perf driver. Until now, getting at those counters meant an out of tree driver poking custom DebugFS nodes. The new driver exposes uncore events the ordinary way, under /sys/bus/event_source/devices/rpi_axi_pmu/, which means perf stat and perf record work against them with no special tooling. On a board where the bus is usually the bottleneck rather than the cores, that is the measurement you have been missing.

The short answer

Ian Rogers of Google posted a patch series on August 11, 2026 adding a mainline Linux driver for the Broadcom AXI performance monitoring unit on Raspberry Pi 1 through 4. It integrates with the standard perf subsystem, exposes uncore events under /sys/bus/event_source/devices/rpi_axi_pmu/, and supports CPU hotplug. Existing solutions were out of tree and used custom DebugFS nodes.

1 to 4Raspberry Pi generations covered by the posted patches
perfthe subsystem the counters now speak, instead of DebugFS
BCM2712the Pi 5 chip still being worked on separately
Answer card explaining that Ian Rogers of Google posted Linux kernel patches on August 11 2026 adding a mainline perf driver for the Broadcom AXI performance monitoring unit on Raspberry Pi 1 through 4, exposing uncore events under sysfs with CPU hotplug support and replacing out of tree DebugFS based drivers, with further work in progress for the BCM2712 in the Raspberry Pi 5.
What the patches do, in one card. Sources: the LKML posting and Phoronix, August 11, 2026. PNG

Anyone who has profiled a Raspberry Pi has run into the same wall. The CPU counters say the cores are stalling on memory. Then what? There has never been a supported way to look at the other side of that stall, because the hardware that could tell you has been sitting behind an out of tree driver and a pile of custom DebugFS files.

Ian Rogers of Google posted patches to the kernel mailing list on August 11, 2026 to fix that. The series adds a mainline friendly driver for the performance counters the Broadcom AXI exposes, with standard Linux perf subsystem integration, uncore events published under /sys/bus/event_source/devices/rpi_axi_pmu/, and CPU hotplug support.

What these counters see that yours do not

AXI is the ARM interconnect protocol. On a Raspberry Pi SoC it is the road every block uses to reach memory: the CPU cores, the GPU, the video decoder, the camera interface, the display engine. A performance monitoring unit sitting on that bus counts what crosses it.

That is a fundamentally different vantage point from a core PMU. Your CPU counters are inside the core and can tell you a load missed and the pipeline stalled. They cannot tell you whether it stalled because your working set is too large, or because a video decode was consuming most of the available bandwidth at that instant. Those two situations produce identical core level symptoms and require opposite fixes.

On a Pi in particular this distinction is not academic. These are boards with modest memory bandwidth shared by a lot of hungry blocks. The bottleneck is on the bus far more often than it is in the cores, and until now the bus was the part you could not measure.

Terminal session on a Raspberry Pi listing the new event source: ls of /sys/bus/event_source/devices showing rpi_axi_pmu alongside armv8_cortex_a72 and software, perf list filtered to the new PMU, and a system wide perf stat run counting bus events during a workload.
How the counters surface once the driver is loaded. Example output, not a capture of a specific board. PNG

Out of tree is not the same as available

There is a version of this story where nothing has changed, because drivers for these counters already existed. That version is wrong, and the reason is worth being precise about.

An out of tree driver is code you carry. It has to be rebuilt against every kernel you move to. It breaks when an internal API shifts, which happens constantly because the kernel offers no stability guarantee there. It cannot be assumed present by anything you write, so every script that uses it needs a fallback path. And in this case it exposed its counters through custom DebugFS nodes, meaning the consumer was also code you wrote: parsing files in a bespoke format instead of asking perf.

Mainline changes the shape of all of that. A driver in the tree gets built by distribution kernels, gets carried forward by whoever refactors the API underneath it, and speaks an interface every profiling tool on the system already understands. perf list enumerates the events. perf stat counts them. Nothing bespoke is involved.

The Pi 5 work is the one to watch

The posted patches cover BCM2835 through BCM2711, which is Raspberry Pi 1 through 4. Separate work is under way for the BCM2712 in the Raspberry Pi 5, and the scope there is noticeably wider: monitors around the PCIe links to the RP1 southbridge, the HEVC decoder, the display engine, and DSU L3 interconnect monitoring.

That list is more interesting than it looks. On a Pi 5 the RP1 southbridge is where USB, Ethernet and most of the board's I/O actually live, reached over PCIe. Anyone who has tried to work out why a Pi 5 running a NAS role or a busy network service does not perform the way the specifications suggest has been guessing about that link. Counters on it turn the guess into a measurement. L3 interconnect monitoring, similarly, is how you tell a cache problem from a bandwidth problem on a four core cluster.

How to use it when it lands

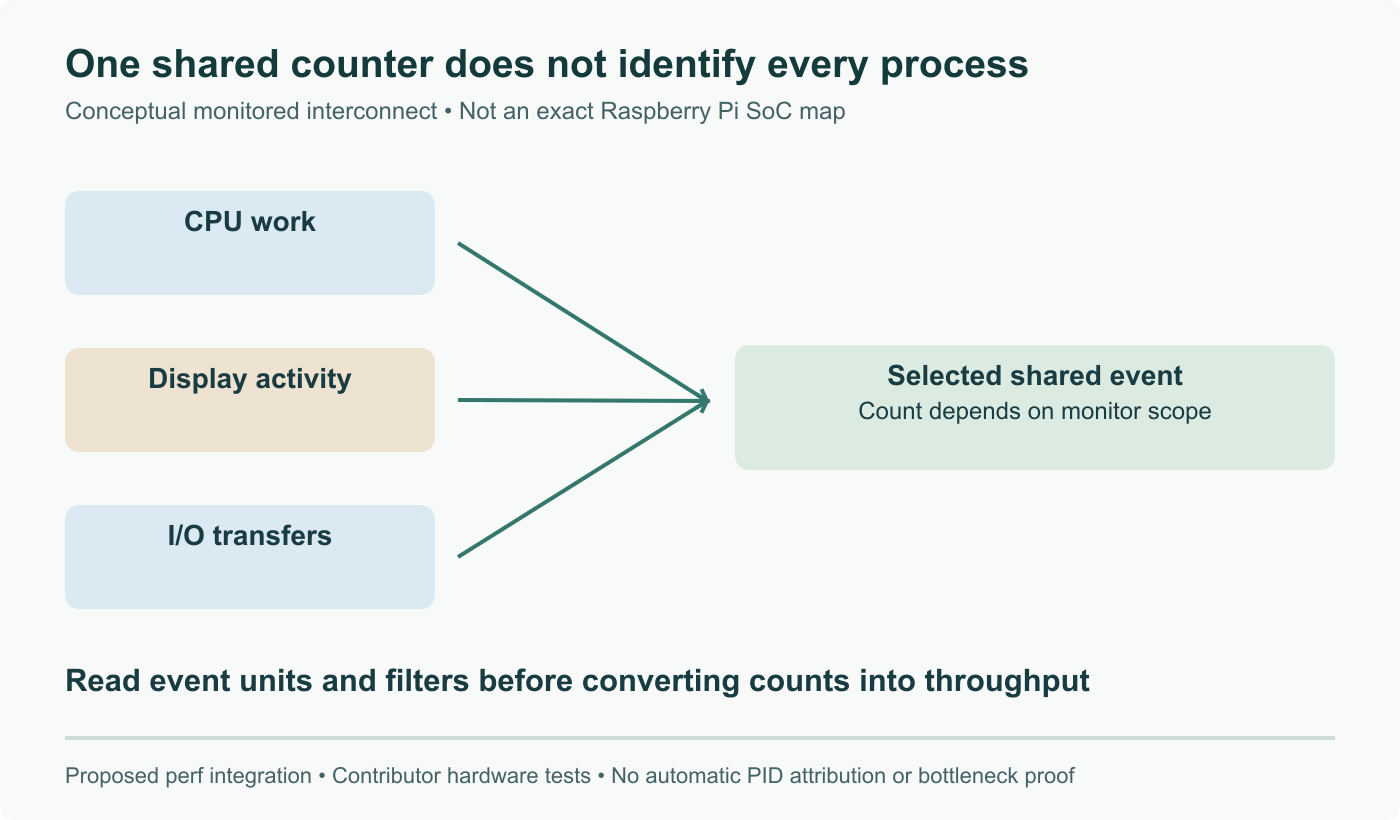
These are system wide counters attached to a bus, not to a process, so the usage pattern differs from what you may be used to. Count with -a and scope by time rather than by task:

Run your workload, count across the whole system for its duration, and compare the bus numbers against a baseline of the machine doing nothing. Per process attribution is not meaningful here because the bus does not know which task issued a transaction, and asking for it will either error or give you something misleading.

The practical question this answers, for anyone deploying these boards in production rather than on a desk, is whether a unit that is not keeping up is CPU bound or bandwidth bound. Those need different answers. One is solved by better code or a faster core, the other by moving work off the board or reducing what else competes for memory. Getting that wrong is expensive at any scale beyond one device, and until now the honest answer on a Pi was that you could not tell without an out of tree driver and a weekend.

If you want to induce the pressure deliberately while you measure it, the debugfs interface for aiming memory pressure at a Linux system we looked at recently pairs naturally with this kind of counter work.

Sources and further reading

Frequently asked questions

What is an AXI PMU and why is it different from the CPU performance counters I already have?

AXI is the ARM bus protocol that connects the CPU cores to memory and to every other block on the chip. A PMU on that bus counts traffic crossing it: reads, writes, outstanding transactions, stalls waiting for a response. Your CPU performance counters live inside the core and can tell you that a load missed in cache and the core stalled. They cannot tell you why, because the answer usually lives on the other side of the bus. Uncore counters like these are how you distinguish between a workload that is genuinely memory hungry and one that is being starved because something else, a camera pipeline or a video decoder, is saturating the same path.

Why does going mainline matter if out of tree drivers already exist?

Because out of tree means you maintain it. A driver that lives outside the kernel tree needs rebuilding against every kernel you upgrade to, breaks silently when internal APIs shift, and cannot be assumed present by any tool or script you write. It also means a bespoke interface: the existing drivers expose counters through custom DebugFS nodes, so anything reading them is code you wrote rather than perf. Landing in mainline turns the counters into a standard event source that `perf list` enumerates and `perf stat` reads, on any distribution kernel, with no build step. That is the difference between a capability you can demonstrate and one you can deploy.

Which boards does this cover today?

The posted patches target the Broadcom BCM2835 through BCM2711, which is Raspberry Pi 1 through Raspberry Pi 4. The Raspberry Pi 5 and its BCM2712 are being worked on separately and the scope there is broader: monitors around the PCIe links to the RP1 southbridge, the HEVC decoder, the display engine, and the DSU L3 interconnect. That Pi 5 set is arguably the more interesting one, because the RP1 southbridge is where USB, Ethernet and most of the I/O on that board actually live, and PCIe link visibility is exactly what you want when a Pi 5 is doing storage or network work.

How would I use this once it lands?

The same way you use any uncore PMU. `perf list` will show the rpi_axi_pmu events once the driver is loaded, and you address them with the usual `pmu/event/` syntax, for example `perf stat -a -e rpi_axi_pmu/some_event/ -- your_workload`. The `-a` matters: these are system wide counters attached to a bus, not to a task, so per process counting is not meaningful for them. You are measuring what the whole SoC is doing to the bus during a window, which is the right frame for the questions these counters answer.

Is this useful outside hobby projects?

Yes, and arguably more so. Raspberry Pi boards do a lot of unglamorous production work: edge gateways, kiosk displays, camera nodes, small automation controllers, test fixtures. Those deployments hit bus and memory limits long before they hit CPU limits, and the usual response is to guess, throw a faster board at it, and hope. Bus level counters replace that guess with a number. If you build products on these boards, the ability to answer whether a unit is CPU bound or bandwidth bound, using stock tooling on a stock kernel, changes how you size hardware.