A faster debugger start can justify extra work during linking. The useful measure is the time across the development loop, including how often a binary is debugged.
What version 0.10 adds
Wild 0.10.0, released August 4, adds --gdb-index and defaults to --no-mmap-output-file on Btrfs and vfat. The release describes a speedup from the latter choice for Wild. It does not establish a universal penalty for every linker or workload on those filesystems.
The GDB manual describes embedded symbol indexes and an optional automatic index cache keyed by ELF build ID. It is therefore incorrect to assume that every debugger start always rebuilds the index from scratch.
A break-even example
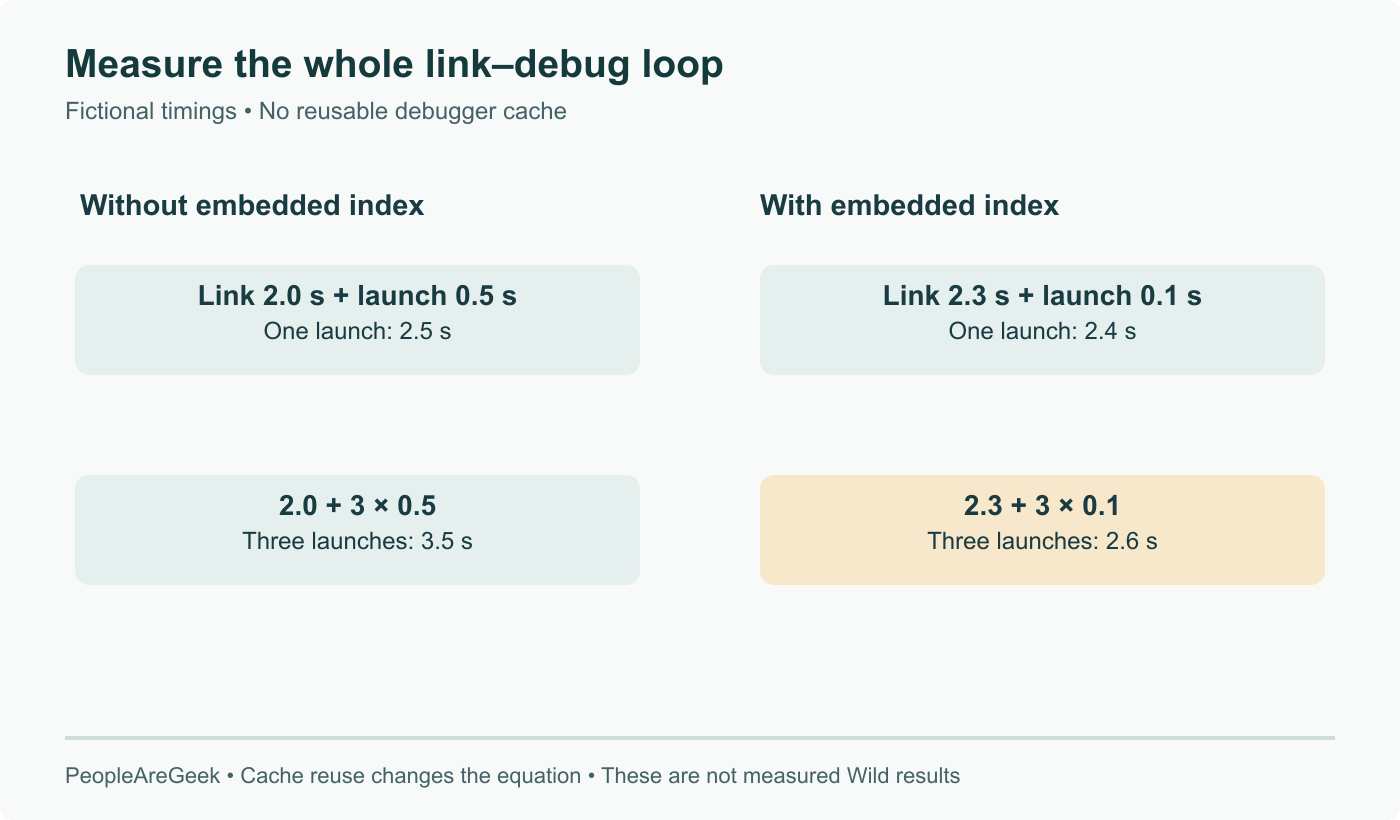
Use fictional measurements to understand the trade, not to predict Wild’s performance. Suppose a link takes 2.0 seconds without index generation and 2.3 seconds with it. A debugger launch takes 0.5 seconds without a usable index and 0.1 seconds with one.
For one debugger launch per link, total time is 2.5 versus 2.4 seconds. For three launches it is 3.5 versus 2.6 seconds. The extra 0.3 seconds at link time is repaid by the assumed 0.4 seconds saved per launch. For a binary never opened in a debugger, it is not repaid.
These numbers deliberately exclude a debugger cache. If the no-embedded-index case reuses a cached index on later launches, its subsequent cost changes and the calculation must change too. The illustration states that assumption rather than turn the example into a benchmark.
What to preserve in a real comparison
Keep debug-information settings, input objects, linker options and the debugger version fixed. Separate fresh and reused caches. Measure the link and the first useful debugger operation, not just process startup without loaded symbols.
For the output-writing change, compare the actual build directory and workload with both policies where supported. Record filesystem, mount options and kernel. The result can guide that project’s configuration without implying that changing a whole machine’s filesystem is necessary.
Finally, verify program behaviour, symbol lookup and breakpoints. A shortened development loop is valuable only if the linked binary and debugging information remain correct.
September 8: verify GDB index and mmap defaults, include GDB’s own cache and replace unsupported filesystem-wide claims with a worked end-to-end break-even example.