Valve’s August 2026 survey puts Linux at 3.90%, down 0.11 percentage point. The useful comparison is between like-for-like shares: it does not establish how many Linux players were gained or lost.
Keep the denominator visible
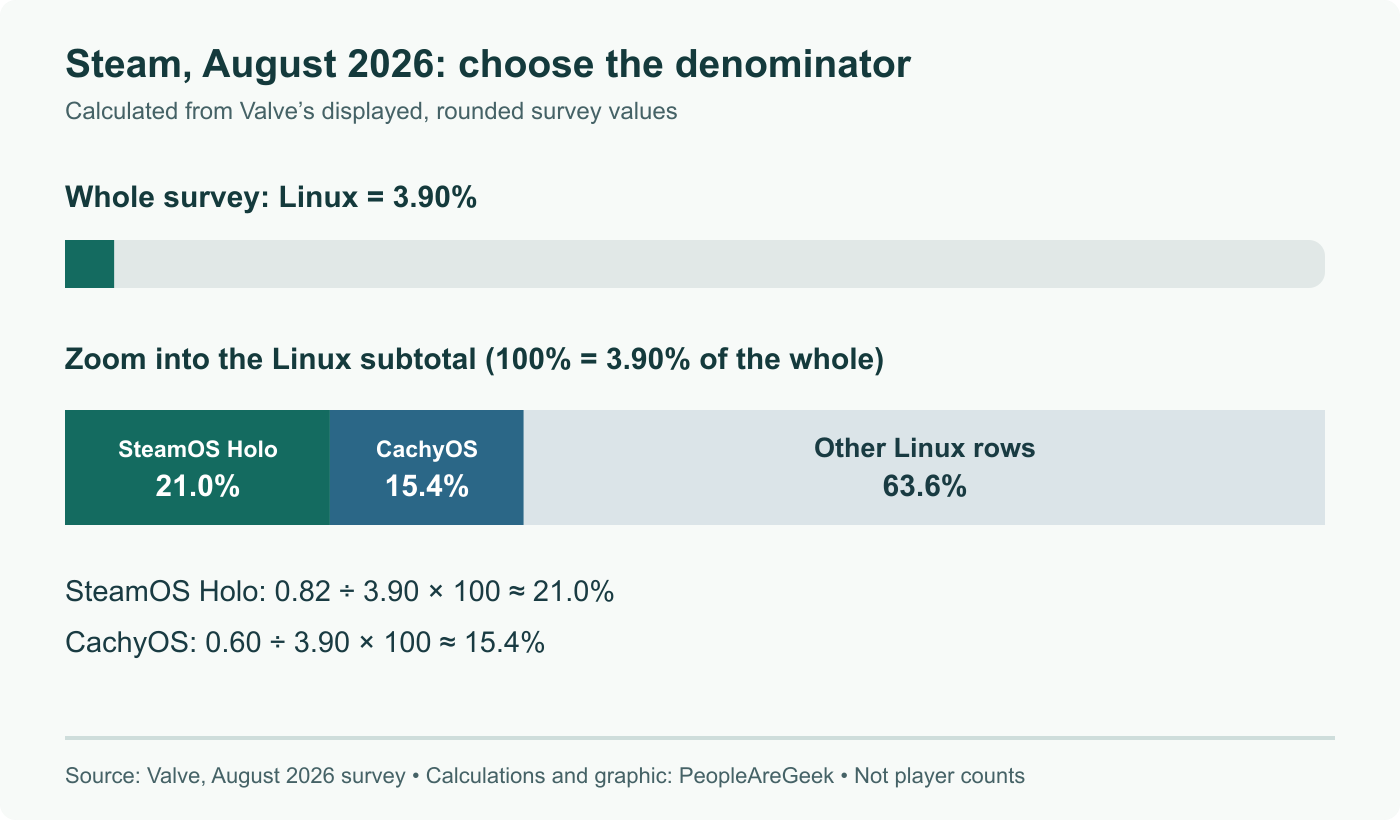
The August survey gives SteamOS Holo 0.82% and CachyOS 0.60% of the combined sample. Participation is optional and anonymous. These figures describe the survey, not all computers or a count of active Steam accounts.
Within the reported Linux total, the calculation is different:
| Calculation from the published rounded shares | Result |
|---|---|
| SteamOS Holo: 0.82 ÷ 3.90 × 100 | about 21.0% of Linux |
| CachyOS: 0.60 ÷ 3.90 × 100 | about 15.4% of Linux |
These are our calculations, not a second measurement by Valve. The diagram separates the full sample from the Linux-only denominator so the two percentages cannot be mistaken for competing readings of the same quantity.
A fall of 0.11 point is not a fall of 0.11%
Reconstructing the previous share from the published change gives 4.01%. The relative change in that share is therefore (3.90 - 4.01) / 4.01 × 100 ≈ -2.74%. The absolute change is -0.11 percentage point. Both statements can be true because they answer different questions.
Neither gives a number of people. To illustrate why, imagine a sample growing from 10,000 to 11,000 responses. At 4.01% and then 3.90%, the Linux counts would be 401 and 429. Those sample sizes are invented for this arithmetic example; they are not Valve’s reported counts. A falling proportion can coexist with a rising count.
CachyOS: calculate the same way in both months
Valve shows a +0.03 point monthly change for CachyOS in the combined sample. Using the rounded values, its previous share would be 0.57%. Relative to Linux, that gives 0.57 / 4.01 ≈ 14.2%, compared with approximately 15.4% in August: an increase of about 1.17 points within Linux, not +1.17 points across Steam.
Rounding limits precision, and separate version rows can fragment a distribution family. The survey alone does not explain why people chose a distribution, establish a causal link with drivers, or prove that a particular vendor ships no preinstalled machines. For tracking adoption, retain month, denominator and grouping rules alongside each number, then compare a series of months rather than treating one fluctuation as a verdict.
Source and method
- Valve Hardware & Software Survey, August 2026 table, checked September 8
- All derived ratios use the displayed rounded values; the 10,000/11,000 example is illustrative. The linked survey page changes each month.
Recalculated percentage points and Linux-only shares from Valve’s August table; removed unsupported adoption and hardware-channel conclusions.