wmbench provides native X11 and Wayland paths for desktop tests. Its methodology is useful, but a ranking from one machine cannot establish that a display protocol is universally faster or more efficient. The current upstream notes also identify tests that cannot be compared across older runs.
Native does not automatically mean equivalent
The upstream README describes automatic native backend selection and an explicit option for XWayland. It also flags missing protocols and requested window sizes that the compositor does not honor. Unsupported work is not a zero-cost success.
That distinction matters for tiling desktops and operations whose Wayland implementation differs from moving an ordinary X11 window. Before comparing a row, establish that both sessions performed the intended operation with comparable geometry.
The project warns that results saved before certain test changes are not comparable for windows, resize and scroll. Keep the benchmark revision with the output; a column name alone is not a stable measurement specification.
Separate maximum rate from the cost of fixed work
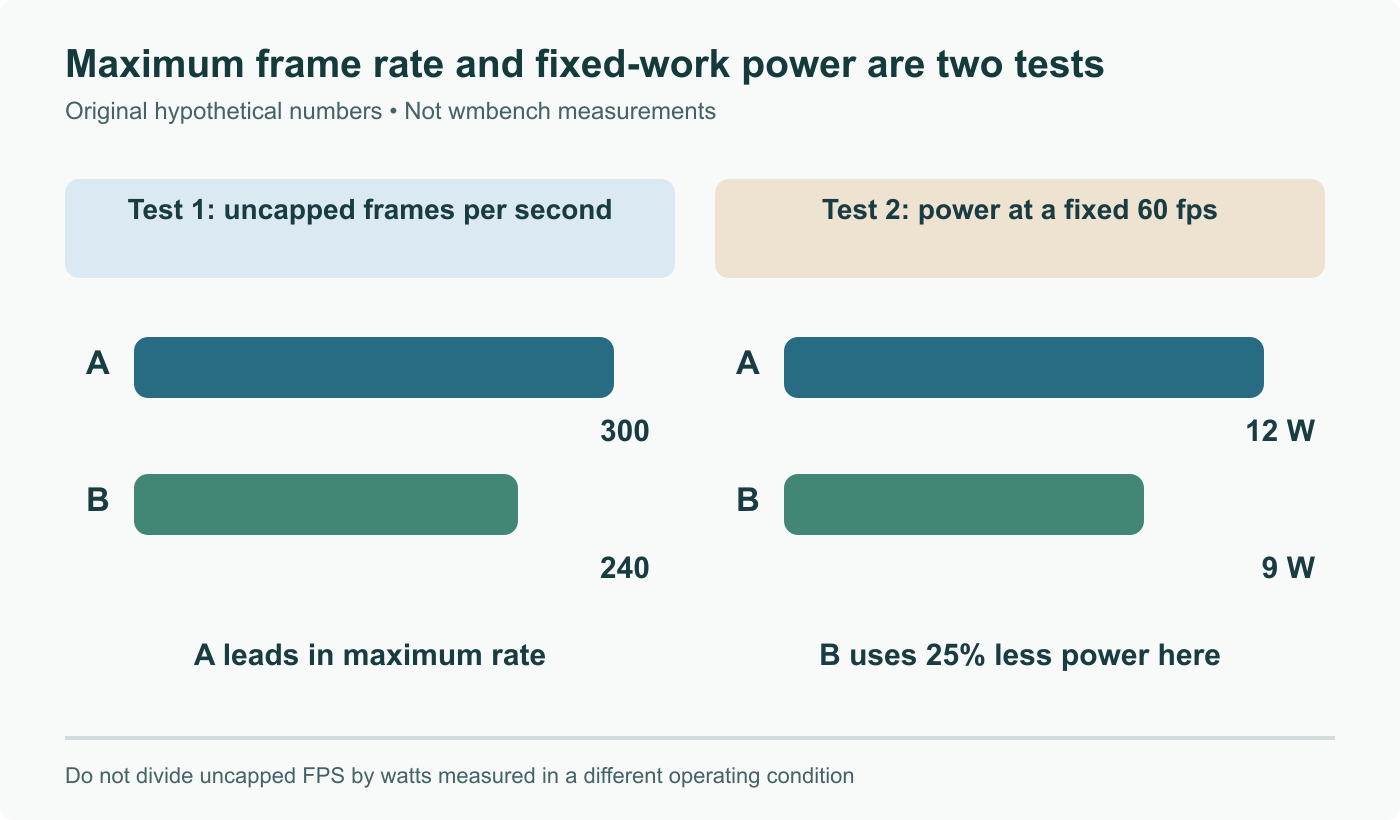
Uncapped frame rate asks how many frames can be produced. Power under a fixed workload asks how much power is required for that workload. They have different denominators and can produce different rankings.
Consider an original example unrelated to measured wmbench results. Session A reaches 300 frames per second when uncapped, while B reaches 240. In a separate fixed 60-frame-per-second workload, A draws 12 W and B draws 9 W. A leads on maximum rate; B uses 25% less power than A in the fixed test. Dividing uncapped frames by the fixed-test watts would combine different operating conditions and produce a misleading efficiency metric.
Neither number gives battery life without the rest of the machine's consumption and workload duration.
Keep missing measurements visible
The sensor documentation in the repository lists hardware-dependent power sources. A missing sensor is not zero consumption. An integrated CPU/GPU reading also must not be treated as two independent measurements and added twice.
For a useful comparison sheet, include session and backend, benchmark revision, monitor size and scale, actual window geometry, sensor coverage and any skipped or failed tests. Separate visual-defect results from speed: a fast run does not establish correct presentation.
PeopleAreGeek has not run this benchmark on a desktop. This revised article focuses on interpreting the instrument rather than repeating a universal winner claim that its methodology cannot support. Run the same revision on the same machine and compare only the rows whose work and measurement boundaries match.
Remove universal protocol ranking; explain native backends, incomparable tests and sensor scope using current upstream methodology.